Costa Rican vs Immigrants from South America Female Unemployment
COMPARE
Costa Rican
Immigrants from South America
Female Unemployment
Female Unemployment Comparison
Costa Ricans
Immigrants from South America
5.3%
FEMALE UNEMPLOYMENT
33.8/ 100
METRIC RATING
189th/ 347
METRIC RANK
5.5%
FEMALE UNEMPLOYMENT
2.9/ 100
METRIC RATING
240th/ 347
METRIC RANK
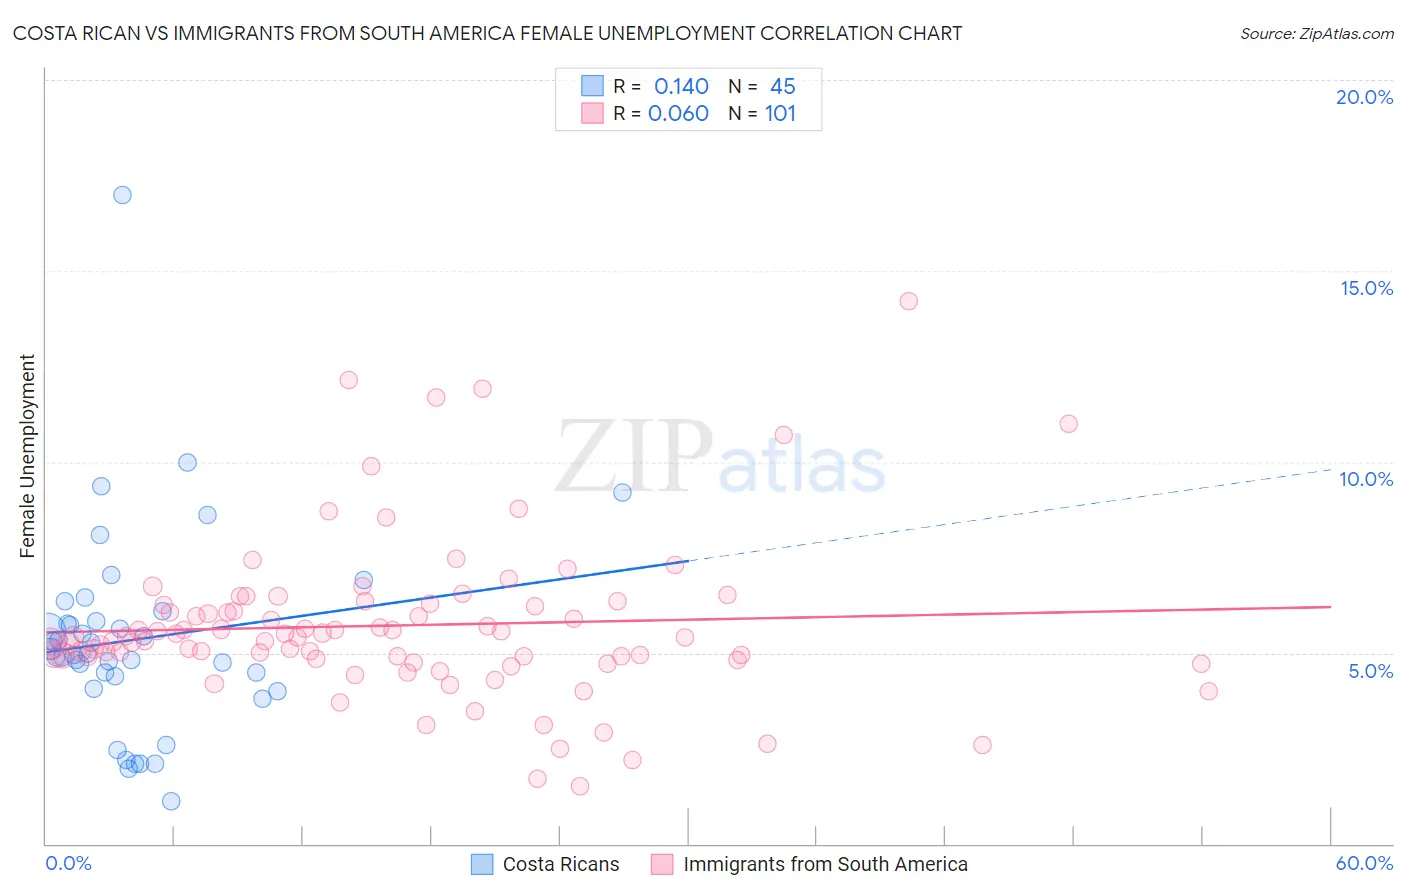
Costa Rican vs Immigrants from South America Female Unemployment Correlation Chart
The statistical analysis conducted on geographies consisting of 253,047,162 people shows a poor positive correlation between the proportion of Costa Ricans and unemploymnet rate among females in the United States with a correlation coefficient (R) of 0.140 and weighted average of 5.3%. Similarly, the statistical analysis conducted on geographies consisting of 482,537,593 people shows a slight positive correlation between the proportion of Immigrants from South America and unemploymnet rate among females in the United States with a correlation coefficient (R) of 0.060 and weighted average of 5.5%, a difference of 4.2%.
Female Unemployment Correlation Summary
| Measurement | Costa Rican | Immigrants from South America |
| Minimum | 1.1% | 1.5% |
| Maximum | 17.0% | 14.2% |
| Range | 15.9% | 12.7% |
| Mean | 5.4% | 5.7% |
| Median | 5.0% | 5.4% |
| Interquartile 25% (IQ1) | 4.2% | 4.9% |
| Interquartile 75% (IQ3) | 6.0% | 6.3% |
| Interquartile Range (IQR) | 1.7% | 1.4% |
| Standard Deviation (Sample) | 2.7% | 2.1% |
| Standard Deviation (Population) | 2.6% | 2.1% |
Similar Demographics by Female Unemployment
Demographics Similar to Costa Ricans by Female Unemployment
In terms of female unemployment, the demographic groups most similar to Costa Ricans are Afghan (5.3%, a difference of 0.0%), Immigrants from Albania (5.3%, a difference of 0.10%), Ugandan (5.3%, a difference of 0.18%), Cherokee (5.3%, a difference of 0.20%), and Immigrants from Belarus (5.3%, a difference of 0.36%).
| Demographics | Rating | Rank | Female Unemployment |
| Immigrants | Nonimmigrants | 42.6 /100 | #182 | Average 5.3% |
| Immigrants | Indonesia | 40.7 /100 | #183 | Average 5.3% |
| Immigrants | Ukraine | 40.1 /100 | #184 | Average 5.3% |
| Malaysians | 40.1 /100 | #185 | Average 5.3% |
| Immigrants | Belarus | 39.4 /100 | #186 | Fair 5.3% |
| Immigrants | Albania | 35.4 /100 | #187 | Fair 5.3% |
| Afghans | 33.9 /100 | #188 | Fair 5.3% |
| Costa Ricans | 33.8 /100 | #189 | Fair 5.3% |
| Ugandans | 31.2 /100 | #190 | Fair 5.3% |
| Cherokee | 30.8 /100 | #191 | Fair 5.3% |
| Portuguese | 28.6 /100 | #192 | Fair 5.3% |
| Arabs | 27.7 /100 | #193 | Fair 5.3% |
| Colombians | 27.0 /100 | #194 | Fair 5.3% |
| Immigrants | Colombia | 26.2 /100 | #195 | Fair 5.3% |
| Spaniards | 25.2 /100 | #196 | Fair 5.3% |
Demographics Similar to Immigrants from South America by Female Unemployment
In terms of female unemployment, the demographic groups most similar to Immigrants from South America are Aleut (5.5%, a difference of 0.040%), South American Indian (5.5%, a difference of 0.050%), Sierra Leonean (5.5%, a difference of 0.14%), Immigrants from Panama (5.5%, a difference of 0.16%), and Immigrants from Cambodia (5.5%, a difference of 0.18%).
| Demographics | Rating | Rank | Female Unemployment |
| Moroccans | 3.4 /100 | #233 | Tragic 5.5% |
| Immigrants | Lebanon | 3.3 /100 | #234 | Tragic 5.5% |
| Immigrants | Iran | 3.3 /100 | #235 | Tragic 5.5% |
| Immigrants | Cambodia | 3.3 /100 | #236 | Tragic 5.5% |
| Immigrants | Panama | 3.2 /100 | #237 | Tragic 5.5% |
| Sierra Leoneans | 3.2 /100 | #238 | Tragic 5.5% |
| Aleuts | 3.0 /100 | #239 | Tragic 5.5% |
| Immigrants | South America | 2.9 /100 | #240 | Tragic 5.5% |
| South American Indians | 2.8 /100 | #241 | Tragic 5.5% |
| Marshallese | 2.3 /100 | #242 | Tragic 5.6% |
| Spanish Americans | 2.2 /100 | #243 | Tragic 5.6% |
| Immigrants | Liberia | 1.5 /100 | #244 | Tragic 5.6% |
| Guamanians/Chamorros | 1.4 /100 | #245 | Tragic 5.6% |
| Japanese | 1.2 /100 | #246 | Tragic 5.6% |
| Immigrants | Western Asia | 1.1 /100 | #247 | Tragic 5.6% |