Costa Rican vs Immigrants from Australia Unemployment Among Ages 16 to 19 years
COMPARE
Costa Rican
Immigrants from Australia
Unemployment Among Ages 16 to 19 years
Unemployment Among Ages 16 to 19 years Comparison
Costa Ricans
Immigrants from Australia
17.4%
UNEMPLOYMENT AMONG AGES 16 TO 19 YEARS
65.9/ 100
METRIC RATING
156th/ 347
METRIC RANK
17.7%
UNEMPLOYMENT AMONG AGES 16 TO 19 YEARS
40.6/ 100
METRIC RATING
193rd/ 347
METRIC RANK
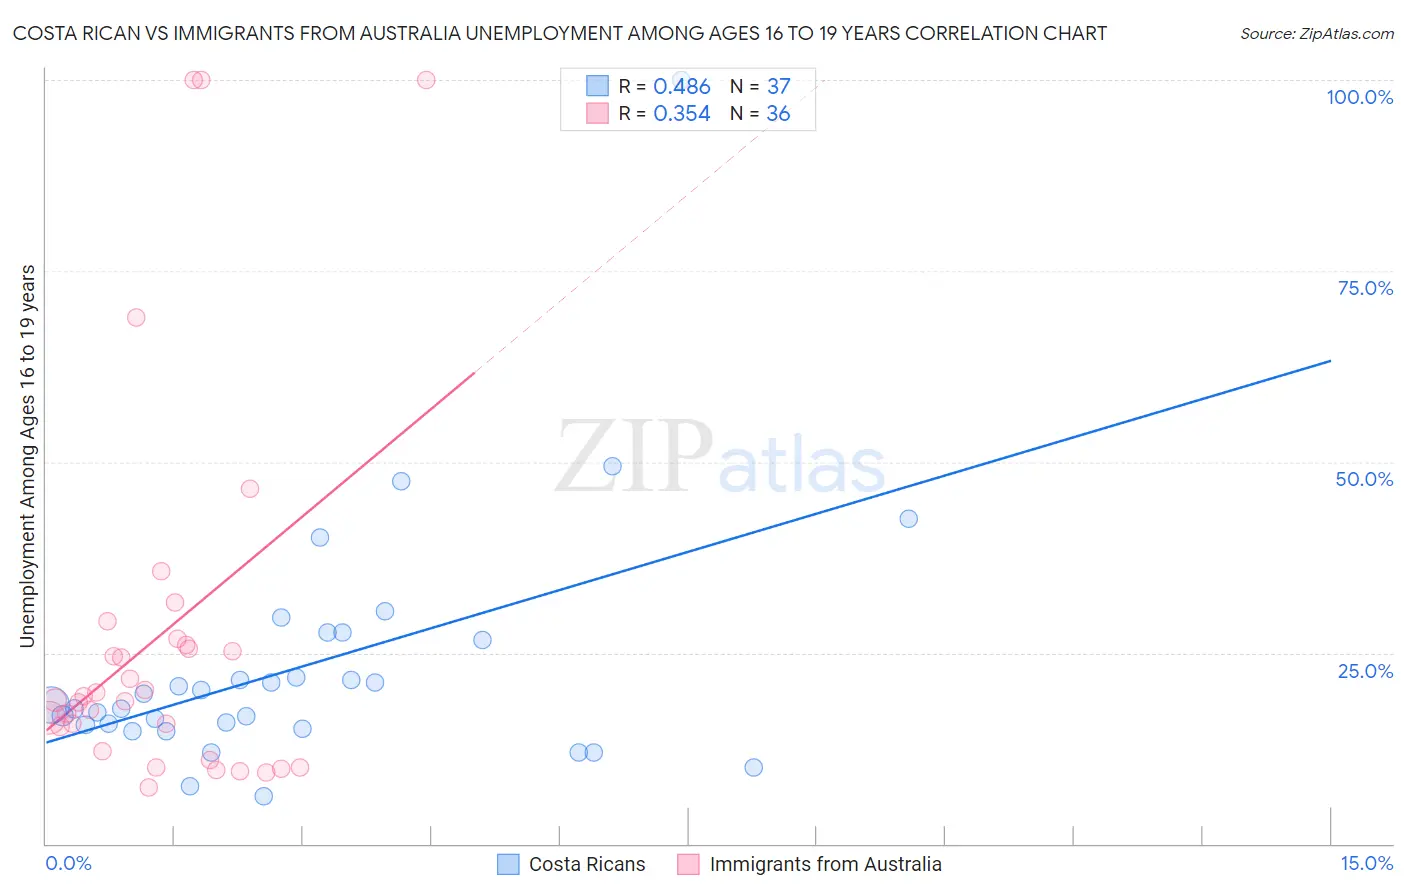
Costa Rican vs Immigrants from Australia Unemployment Among Ages 16 to 19 years Correlation Chart
The statistical analysis conducted on geographies consisting of 245,990,367 people shows a moderate positive correlation between the proportion of Costa Ricans and unemployment rate among population between the ages 16 and 19 in the United States with a correlation coefficient (R) of 0.486 and weighted average of 17.4%. Similarly, the statistical analysis conducted on geographies consisting of 218,730,199 people shows a mild positive correlation between the proportion of Immigrants from Australia and unemployment rate among population between the ages 16 and 19 in the United States with a correlation coefficient (R) of 0.354 and weighted average of 17.7%, a difference of 1.2%.
Unemployment Among Ages 16 to 19 years Correlation Summary
| Measurement | Costa Rican | Immigrants from Australia |
| Minimum | 6.3% | 7.3% |
| Maximum | 100.0% | 100.0% |
| Range | 93.7% | 92.7% |
| Mean | 23.3% | 27.4% |
| Median | 18.1% | 19.0% |
| Interquartile 25% (IQ1) | 15.3% | 13.7% |
| Interquartile 75% (IQ3) | 27.1% | 26.5% |
| Interquartile Range (IQR) | 11.8% | 12.7% |
| Standard Deviation (Sample) | 16.5% | 25.1% |
| Standard Deviation (Population) | 16.2% | 24.7% |
Similar Demographics by Unemployment Among Ages 16 to 19 years
Demographics Similar to Costa Ricans by Unemployment Among Ages 16 to 19 years
In terms of unemployment among ages 16 to 19 years, the demographic groups most similar to Costa Ricans are Portuguese (17.4%, a difference of 0.070%), Uruguayan (17.5%, a difference of 0.080%), Immigrants from China (17.5%, a difference of 0.090%), Afghan (17.4%, a difference of 0.12%), and Immigrants from Afghanistan (17.4%, a difference of 0.14%).
| Demographics | Rating | Rank | Unemployment Among Ages 16 to 19 years |
| Immigrants | Eastern Asia | 73.8 /100 | #149 | Good 17.4% |
| Immigrants | Northern Europe | 72.5 /100 | #150 | Good 17.4% |
| Immigrants | Hong Kong | 69.3 /100 | #151 | Good 17.4% |
| Immigrants | Northern Africa | 69.0 /100 | #152 | Good 17.4% |
| Immigrants | Afghanistan | 68.6 /100 | #153 | Good 17.4% |
| Afghans | 68.1 /100 | #154 | Good 17.4% |
| Portuguese | 67.3 /100 | #155 | Good 17.4% |
| Costa Ricans | 65.9 /100 | #156 | Good 17.4% |
| Uruguayans | 64.3 /100 | #157 | Good 17.5% |
| Immigrants | China | 64.1 /100 | #158 | Good 17.5% |
| Koreans | 61.0 /100 | #159 | Good 17.5% |
| Ukrainians | 60.5 /100 | #160 | Good 17.5% |
| Immigrants | Denmark | 60.3 /100 | #161 | Good 17.5% |
| Immigrants | Norway | 59.8 /100 | #162 | Average 17.5% |
| Egyptians | 59.7 /100 | #163 | Average 17.5% |
Demographics Similar to Immigrants from Australia by Unemployment Among Ages 16 to 19 years
In terms of unemployment among ages 16 to 19 years, the demographic groups most similar to Immigrants from Australia are Immigrants from Philippines (17.7%, a difference of 0.0%), Immigrants from Costa Rica (17.6%, a difference of 0.030%), Marshallese (17.6%, a difference of 0.050%), Immigrants from Europe (17.6%, a difference of 0.060%), and Immigrants from Nicaragua (17.6%, a difference of 0.080%).
| Demographics | Rating | Rank | Unemployment Among Ages 16 to 19 years |
| Japanese | 43.2 /100 | #186 | Average 17.6% |
| Immigrants | Micronesia | 42.4 /100 | #187 | Average 17.6% |
| Immigrants | Nicaragua | 42.2 /100 | #188 | Average 17.6% |
| Immigrants | Europe | 41.8 /100 | #189 | Average 17.6% |
| Marshallese | 41.7 /100 | #190 | Average 17.6% |
| Immigrants | Costa Rica | 41.3 /100 | #191 | Average 17.6% |
| Immigrants | Philippines | 40.7 /100 | #192 | Average 17.7% |
| Immigrants | Australia | 40.6 /100 | #193 | Average 17.7% |
| Peruvians | 38.8 /100 | #194 | Fair 17.7% |
| Immigrants | Peru | 37.3 /100 | #195 | Fair 17.7% |
| Alaskan Athabascans | 34.1 /100 | #196 | Fair 17.7% |
| Immigrants | Czechoslovakia | 29.8 /100 | #197 | Fair 17.8% |
| Ethiopians | 29.6 /100 | #198 | Fair 17.8% |
| Immigrants | Ireland | 28.5 /100 | #199 | Fair 17.8% |
| Immigrants | Fiji | 27.7 /100 | #200 | Fair 17.8% |