Comanche vs Slovak Unemployment Among Women with Children Ages 6 to 17 years
COMPARE
Comanche
Slovak
Unemployment Among Women with Children Ages 6 to 17 years
Unemployment Among Women with Children Ages 6 to 17 years Comparison
Comanche
Slovaks
9.0%
UNEMPLOYMENT AMONG WOMEN WITH CHILDREN AGES 6 TO 17 YEARS
30.0/ 100
METRIC RATING
187th/ 347
METRIC RANK
9.8%
UNEMPLOYMENT AMONG WOMEN WITH CHILDREN AGES 6 TO 17 YEARS
0.0/ 100
METRIC RATING
282nd/ 347
METRIC RANK
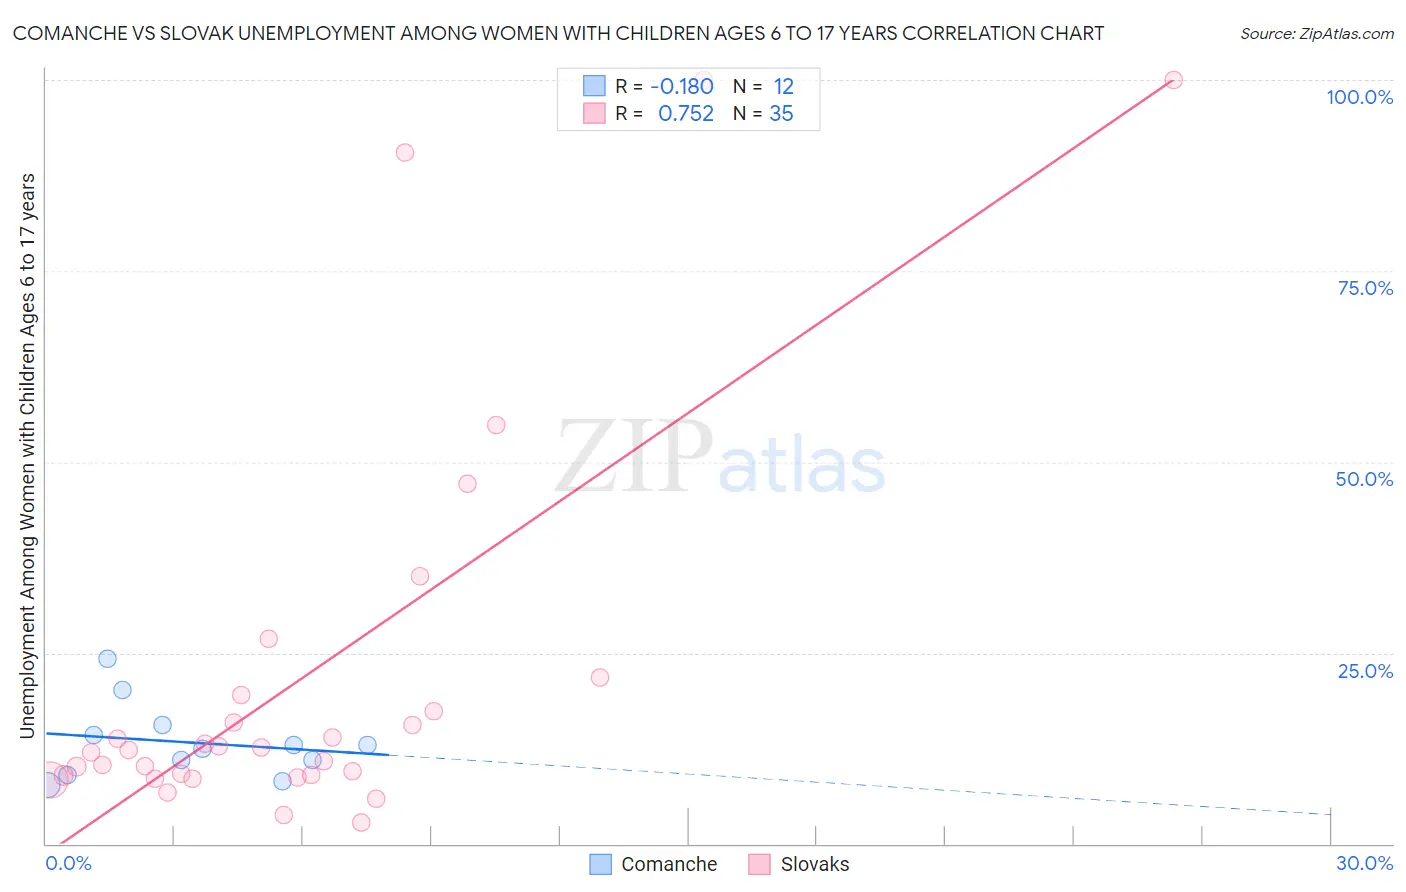
Comanche vs Slovak Unemployment Among Women with Children Ages 6 to 17 years Correlation Chart
The statistical analysis conducted on geographies consisting of 95,114,183 people shows a poor negative correlation between the proportion of Comanche and unemployment rate among women with children between the ages 6 and 17 in the United States with a correlation coefficient (R) of -0.180 and weighted average of 9.0%. Similarly, the statistical analysis conducted on geographies consisting of 272,612,741 people shows a strong positive correlation between the proportion of Slovaks and unemployment rate among women with children between the ages 6 and 17 in the United States with a correlation coefficient (R) of 0.752 and weighted average of 9.8%, a difference of 8.2%.
Unemployment Among Women with Children Ages 6 to 17 years Correlation Summary
| Measurement | Comanche | Slovak |
| Minimum | 7.7% | 2.7% |
| Maximum | 24.2% | 100.0% |
| Range | 16.5% | 97.3% |
| Mean | 13.3% | 21.9% |
| Median | 12.7% | 12.3% |
| Interquartile 25% (IQ1) | 10.0% | 8.9% |
| Interquartile 75% (IQ3) | 14.9% | 19.5% |
| Interquartile Range (IQR) | 4.9% | 10.5% |
| Standard Deviation (Sample) | 4.9% | 25.8% |
| Standard Deviation (Population) | 4.7% | 25.4% |
Similar Demographics by Unemployment Among Women with Children Ages 6 to 17 years
Demographics Similar to Comanche by Unemployment Among Women with Children Ages 6 to 17 years
In terms of unemployment among women with children ages 6 to 17 years, the demographic groups most similar to Comanche are Immigrants from Syria (9.1%, a difference of 0.020%), Immigrants (9.1%, a difference of 0.050%), Slovene (9.1%, a difference of 0.080%), Belizean (9.1%, a difference of 0.080%), and Immigrants from Spain (9.0%, a difference of 0.12%).
| Demographics | Rating | Rank | Unemployment Among Women with Children Ages 6 to 17 years |
| Ethiopians | 37.6 /100 | #180 | Fair 9.0% |
| Immigrants | Czechoslovakia | 34.5 /100 | #181 | Fair 9.0% |
| South American Indians | 34.4 /100 | #182 | Fair 9.0% |
| Swiss | 33.5 /100 | #183 | Fair 9.0% |
| Palestinians | 33.4 /100 | #184 | Fair 9.0% |
| Immigrants | Congo | 32.5 /100 | #185 | Fair 9.0% |
| Immigrants | Spain | 32.4 /100 | #186 | Fair 9.0% |
| Comanche | 30.0 /100 | #187 | Fair 9.0% |
| Immigrants | Syria | 29.7 /100 | #188 | Fair 9.1% |
| Immigrants | Immigrants | 29.2 /100 | #189 | Fair 9.1% |
| Slovenes | 28.5 /100 | #190 | Fair 9.1% |
| Belizeans | 28.4 /100 | #191 | Fair 9.1% |
| Guamanians/Chamorros | 27.2 /100 | #192 | Fair 9.1% |
| Immigrants | Turkey | 25.8 /100 | #193 | Fair 9.1% |
| Immigrants | Kazakhstan | 25.3 /100 | #194 | Fair 9.1% |
Demographics Similar to Slovaks by Unemployment Among Women with Children Ages 6 to 17 years
In terms of unemployment among women with children ages 6 to 17 years, the demographic groups most similar to Slovaks are Jamaican (9.8%, a difference of 0.23%), Seminole (9.7%, a difference of 0.76%), Central American Indian (9.9%, a difference of 0.83%), Scotch-Irish (9.7%, a difference of 0.95%), and Yakama (9.9%, a difference of 0.98%).
| Demographics | Rating | Rank | Unemployment Among Women with Children Ages 6 to 17 years |
| U.S. Virgin Islanders | 0.1 /100 | #275 | Tragic 9.7% |
| Immigrants | Portugal | 0.1 /100 | #276 | Tragic 9.7% |
| British West Indians | 0.1 /100 | #277 | Tragic 9.7% |
| French | 0.1 /100 | #278 | Tragic 9.7% |
| Scotch-Irish | 0.1 /100 | #279 | Tragic 9.7% |
| Seminole | 0.1 /100 | #280 | Tragic 9.7% |
| Jamaicans | 0.0 /100 | #281 | Tragic 9.8% |
| Slovaks | 0.0 /100 | #282 | Tragic 9.8% |
| Central American Indians | 0.0 /100 | #283 | Tragic 9.9% |
| Yakama | 0.0 /100 | #284 | Tragic 9.9% |
| Hispanics or Latinos | 0.0 /100 | #285 | Tragic 9.9% |
| Choctaw | 0.0 /100 | #286 | Tragic 9.9% |
| Sierra Leoneans | 0.0 /100 | #287 | Tragic 9.9% |
| Shoshone | 0.0 /100 | #288 | Tragic 10.0% |
| Hondurans | 0.0 /100 | #289 | Tragic 10.0% |