Comanche vs Osage Unemployment Among Women with Children Under 6 years
COMPARE
Comanche
Osage
Unemployment Among Women with Children Under 6 years
Unemployment Among Women with Children Under 6 years Comparison
Comanche
Osage
8.0%
UNEMPLOYMENT AMONG WOMEN WITH CHILDREN UNDER 6 YEARS
4.3/ 100
METRIC RATING
235th/ 347
METRIC RANK
9.5%
UNEMPLOYMENT AMONG WOMEN WITH CHILDREN UNDER 6 YEARS
0.0/ 100
METRIC RATING
318th/ 347
METRIC RANK
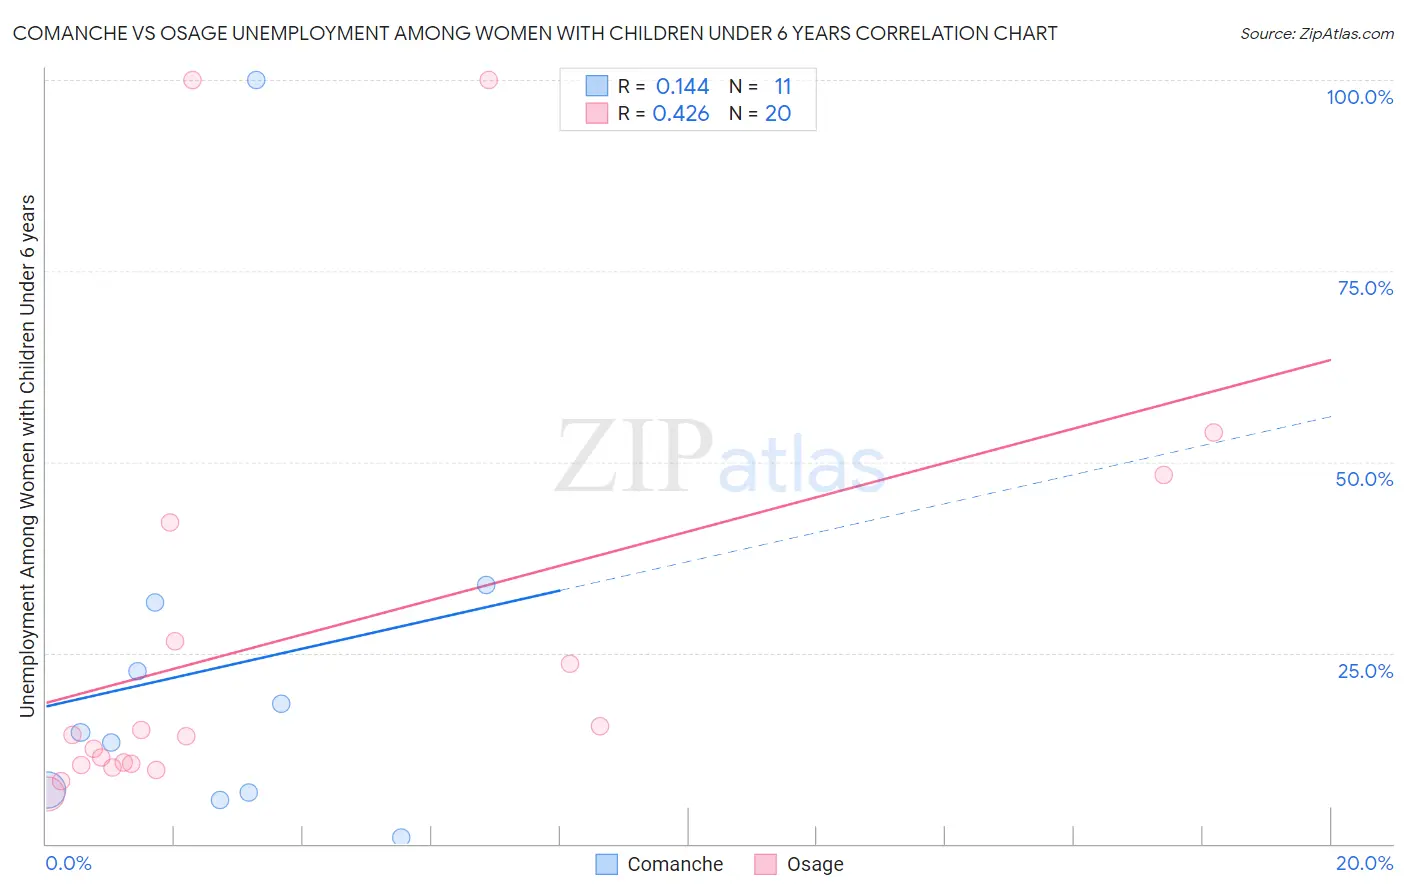
Comanche vs Osage Unemployment Among Women with Children Under 6 years Correlation Chart
The statistical analysis conducted on geographies consisting of 96,385,597 people shows a poor positive correlation between the proportion of Comanche and unemployment rate among women with children under the age of 6 in the United States with a correlation coefficient (R) of 0.144 and weighted average of 8.0%. Similarly, the statistical analysis conducted on geographies consisting of 83,364,360 people shows a moderate positive correlation between the proportion of Osage and unemployment rate among women with children under the age of 6 in the United States with a correlation coefficient (R) of 0.426 and weighted average of 9.5%, a difference of 17.9%.
Unemployment Among Women with Children Under 6 years Correlation Summary
| Measurement | Comanche | Osage |
| Minimum | 0.90% | 6.6% |
| Maximum | 100.0% | 100.0% |
| Range | 99.1% | 93.4% |
| Mean | 23.1% | 27.1% |
| Median | 14.6% | 14.2% |
| Interquartile 25% (IQ1) | 6.7% | 10.4% |
| Interquartile 75% (IQ3) | 31.6% | 34.3% |
| Interquartile Range (IQR) | 24.9% | 23.9% |
| Standard Deviation (Sample) | 27.6% | 28.4% |
| Standard Deviation (Population) | 26.3% | 27.7% |
Similar Demographics by Unemployment Among Women with Children Under 6 years
Demographics Similar to Comanche by Unemployment Among Women with Children Under 6 years
In terms of unemployment among women with children under 6 years, the demographic groups most similar to Comanche are Immigrants from Barbados (8.0%, a difference of 0.020%), Kiowa (8.0%, a difference of 0.040%), Immigrants from Costa Rica (8.0%, a difference of 0.080%), Immigrants from Trinidad and Tobago (8.0%, a difference of 0.18%), and Welsh (8.0%, a difference of 0.27%).
| Demographics | Rating | Rank | Unemployment Among Women with Children Under 6 years |
| Immigrants | Sudan | 6.0 /100 | #228 | Tragic 8.0% |
| Salvadorans | 5.5 /100 | #229 | Tragic 8.0% |
| Finns | 5.3 /100 | #230 | Tragic 8.0% |
| Trinidadians and Tobagonians | 5.3 /100 | #231 | Tragic 8.0% |
| Welsh | 5.0 /100 | #232 | Tragic 8.0% |
| Immigrants | Trinidad and Tobago | 4.8 /100 | #233 | Tragic 8.0% |
| Kiowa | 4.4 /100 | #234 | Tragic 8.0% |
| Comanche | 4.3 /100 | #235 | Tragic 8.0% |
| Immigrants | Barbados | 4.2 /100 | #236 | Tragic 8.0% |
| Immigrants | Costa Rica | 4.1 /100 | #237 | Tragic 8.0% |
| Immigrants | Middle Africa | 3.2 /100 | #238 | Tragic 8.1% |
| Irish | 2.7 /100 | #239 | Tragic 8.1% |
| Immigrants | El Salvador | 2.6 /100 | #240 | Tragic 8.1% |
| Liberians | 2.6 /100 | #241 | Tragic 8.1% |
| Dutch | 2.5 /100 | #242 | Tragic 8.1% |
Demographics Similar to Osage by Unemployment Among Women with Children Under 6 years
In terms of unemployment among women with children under 6 years, the demographic groups most similar to Osage are Dutch West Indian (9.5%, a difference of 0.060%), Houma (9.4%, a difference of 0.85%), Marshallese (9.6%, a difference of 1.0%), Potawatomi (9.6%, a difference of 1.1%), and Central American Indian (9.6%, a difference of 1.1%).
| Demographics | Rating | Rank | Unemployment Among Women with Children Under 6 years |
| French American Indians | 0.0 /100 | #311 | Tragic 9.2% |
| Immigrants | Azores | 0.0 /100 | #312 | Tragic 9.2% |
| Americans | 0.0 /100 | #313 | Tragic 9.3% |
| Fijians | 0.0 /100 | #314 | Tragic 9.3% |
| Cherokee | 0.0 /100 | #315 | Tragic 9.3% |
| Houma | 0.0 /100 | #316 | Tragic 9.4% |
| Dutch West Indians | 0.0 /100 | #317 | Tragic 9.5% |
| Osage | 0.0 /100 | #318 | Tragic 9.5% |
| Marshallese | 0.0 /100 | #319 | Tragic 9.6% |
| Potawatomi | 0.0 /100 | #320 | Tragic 9.6% |
| Central American Indians | 0.0 /100 | #321 | Tragic 9.6% |
| Alaska Natives | 0.0 /100 | #322 | Tragic 9.6% |
| Immigrants | Bahamas | 0.0 /100 | #323 | Tragic 9.6% |
| Paiute | 0.0 /100 | #324 | Tragic 9.7% |
| Choctaw | 0.0 /100 | #325 | Tragic 9.8% |