Immigrants from Europe vs Yuman Unemployment Among Ages 45 to 54 years
COMPARE
Immigrants from Europe
Yuman
Unemployment Among Ages 45 to 54 years
Unemployment Among Ages 45 to 54 years Comparison
Immigrants from Europe
Yuman
4.5%
UNEMPLOYMENT AMONG AGES 45 TO 54 YEARS
54.7/ 100
METRIC RATING
168th/ 347
METRIC RANK
9.5%
UNEMPLOYMENT AMONG AGES 45 TO 54 YEARS
0.0/ 100
METRIC RATING
344th/ 347
METRIC RANK
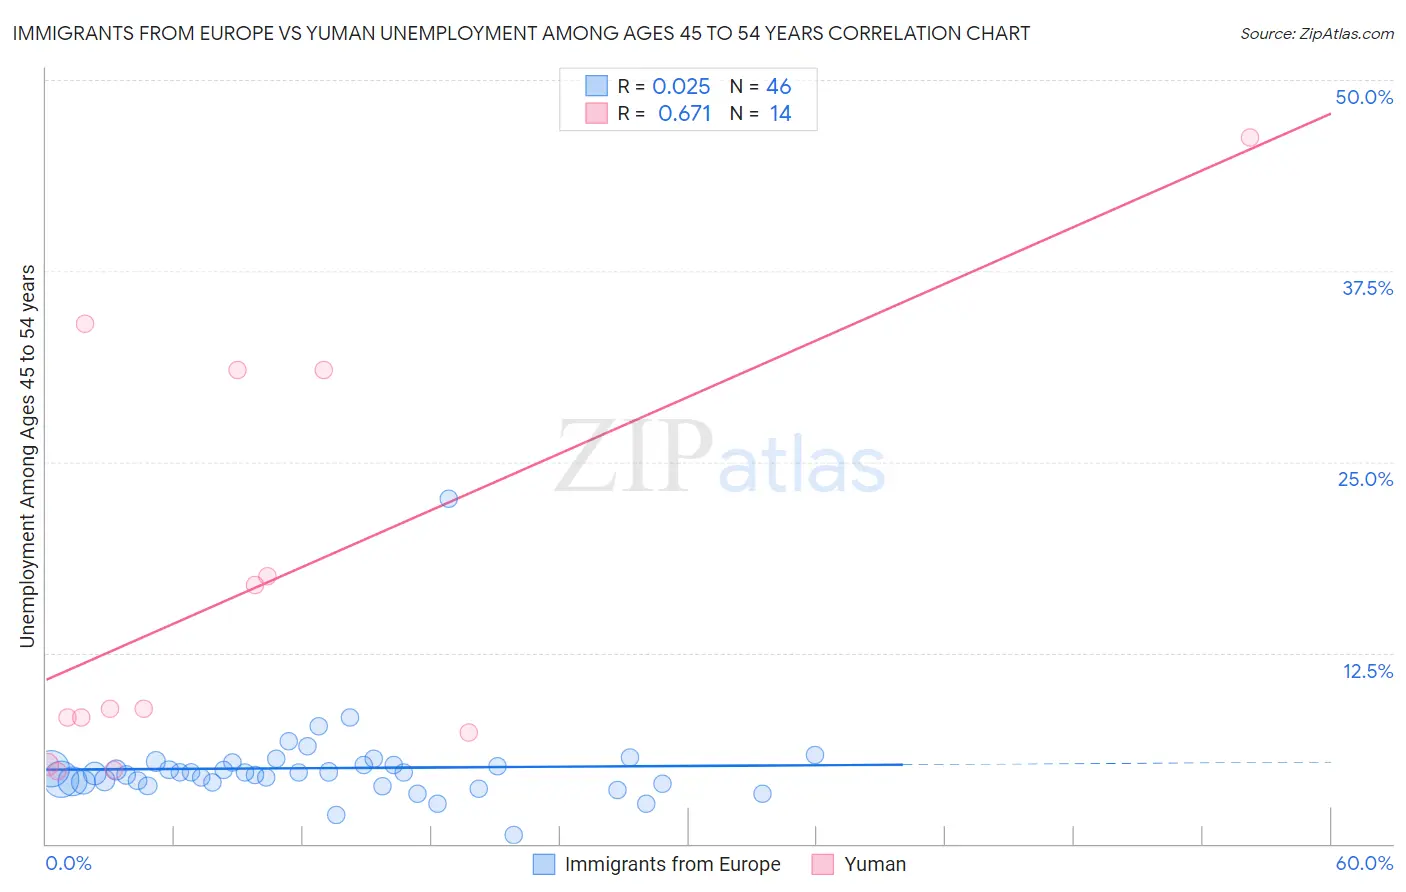
Immigrants from Europe vs Yuman Unemployment Among Ages 45 to 54 years Correlation Chart
The statistical analysis conducted on geographies consisting of 515,197,690 people shows no correlation between the proportion of Immigrants from Europe and unemployment rate among population between the ages 45 and 54 in the United States with a correlation coefficient (R) of 0.025 and weighted average of 4.5%. Similarly, the statistical analysis conducted on geographies consisting of 40,470,848 people shows a significant positive correlation between the proportion of Yuman and unemployment rate among population between the ages 45 and 54 in the United States with a correlation coefficient (R) of 0.671 and weighted average of 9.5%, a difference of 110.4%.
Unemployment Among Ages 45 to 54 years Correlation Summary
| Measurement | Immigrants from Europe | Yuman |
| Minimum | 0.60% | 4.8% |
| Maximum | 22.6% | 46.2% |
| Range | 22.0% | 41.4% |
| Mean | 5.0% | 16.6% |
| Median | 4.6% | 8.8% |
| Interquartile 25% (IQ1) | 4.0% | 7.3% |
| Interquartile 75% (IQ3) | 5.2% | 31.0% |
| Interquartile Range (IQR) | 1.2% | 23.7% |
| Standard Deviation (Sample) | 3.0% | 13.4% |
| Standard Deviation (Population) | 2.9% | 13.0% |
Similar Demographics by Unemployment Among Ages 45 to 54 years
Demographics Similar to Immigrants from Europe by Unemployment Among Ages 45 to 54 years
In terms of unemployment among ages 45 to 54 years, the demographic groups most similar to Immigrants from Europe are Immigrants from Egypt (4.5%, a difference of 0.0%), Spaniard (4.5%, a difference of 0.020%), Egyptian (4.5%, a difference of 0.050%), Colombian (4.5%, a difference of 0.070%), and Immigrants from Brazil (4.5%, a difference of 0.080%).
| Demographics | Rating | Rank | Unemployment Among Ages 45 to 54 years |
| Immigrants | Eastern Europe | 61.6 /100 | #161 | Good 4.5% |
| Immigrants | Indonesia | 60.3 /100 | #162 | Good 4.5% |
| Bangladeshis | 59.7 /100 | #163 | Average 4.5% |
| Samoans | 58.5 /100 | #164 | Average 4.5% |
| Maltese | 57.9 /100 | #165 | Average 4.5% |
| Immigrants | Western Europe | 57.4 /100 | #166 | Average 4.5% |
| Immigrants | Brazil | 56.4 /100 | #167 | Average 4.5% |
| Immigrants | Europe | 54.7 /100 | #168 | Average 4.5% |
| Immigrants | Egypt | 54.7 /100 | #169 | Average 4.5% |
| Spaniards | 54.3 /100 | #170 | Average 4.5% |
| Egyptians | 53.6 /100 | #171 | Average 4.5% |
| Colombians | 53.3 /100 | #172 | Average 4.5% |
| Immigrants | Colombia | 52.0 /100 | #173 | Average 4.5% |
| Immigrants | Hungary | 50.0 /100 | #174 | Average 4.5% |
| Immigrants | France | 49.4 /100 | #175 | Average 4.5% |
Demographics Similar to Yuman by Unemployment Among Ages 45 to 54 years
In terms of unemployment among ages 45 to 54 years, the demographic groups most similar to Yuman are Inupiat (9.2%, a difference of 3.3%), Cheyenne (10.6%, a difference of 11.3%), Alaskan Athabascan (8.5%, a difference of 12.2%), Paiute (7.8%, a difference of 22.0%), and Yup'ik (11.9%, a difference of 25.2%).
| Demographics | Rating | Rank | Unemployment Among Ages 45 to 54 years |
| Immigrants | Yemen | 0.0 /100 | #333 | Tragic 6.5% |
| Sioux | 0.0 /100 | #334 | Tragic 6.6% |
| Navajo | 0.0 /100 | #335 | Tragic 6.7% |
| Puerto Ricans | 0.0 /100 | #336 | Tragic 6.8% |
| Apache | 0.0 /100 | #337 | Tragic 7.0% |
| Colville | 0.0 /100 | #338 | Tragic 7.4% |
| Arapaho | 0.0 /100 | #339 | Tragic 7.5% |
| Hopi | 0.0 /100 | #340 | Tragic 7.5% |
| Paiute | 0.0 /100 | #341 | Tragic 7.8% |
| Alaskan Athabascans | 0.0 /100 | #342 | Tragic 8.5% |
| Inupiat | 0.0 /100 | #343 | Tragic 9.2% |
| Yuman | 0.0 /100 | #344 | Tragic 9.5% |
| Cheyenne | 0.0 /100 | #345 | Tragic 10.6% |
| Yup'ik | 0.0 /100 | #346 | Tragic 11.9% |
| Crow | 0.0 /100 | #347 | Tragic 13.7% |