Colombian vs Immigrants from England Unemployment Among Ages 65 to 74 years
COMPARE
Colombian
Immigrants from England
Unemployment Among Ages 65 to 74 years
Unemployment Among Ages 65 to 74 years Comparison
Colombians
Immigrants from England
5.6%
UNEMPLOYMENT AMONG AGES 65 TO 74 YEARS
0.5/ 100
METRIC RATING
252nd/ 347
METRIC RANK
5.3%
UNEMPLOYMENT AMONG AGES 65 TO 74 YEARS
86.2/ 100
METRIC RATING
129th/ 347
METRIC RANK
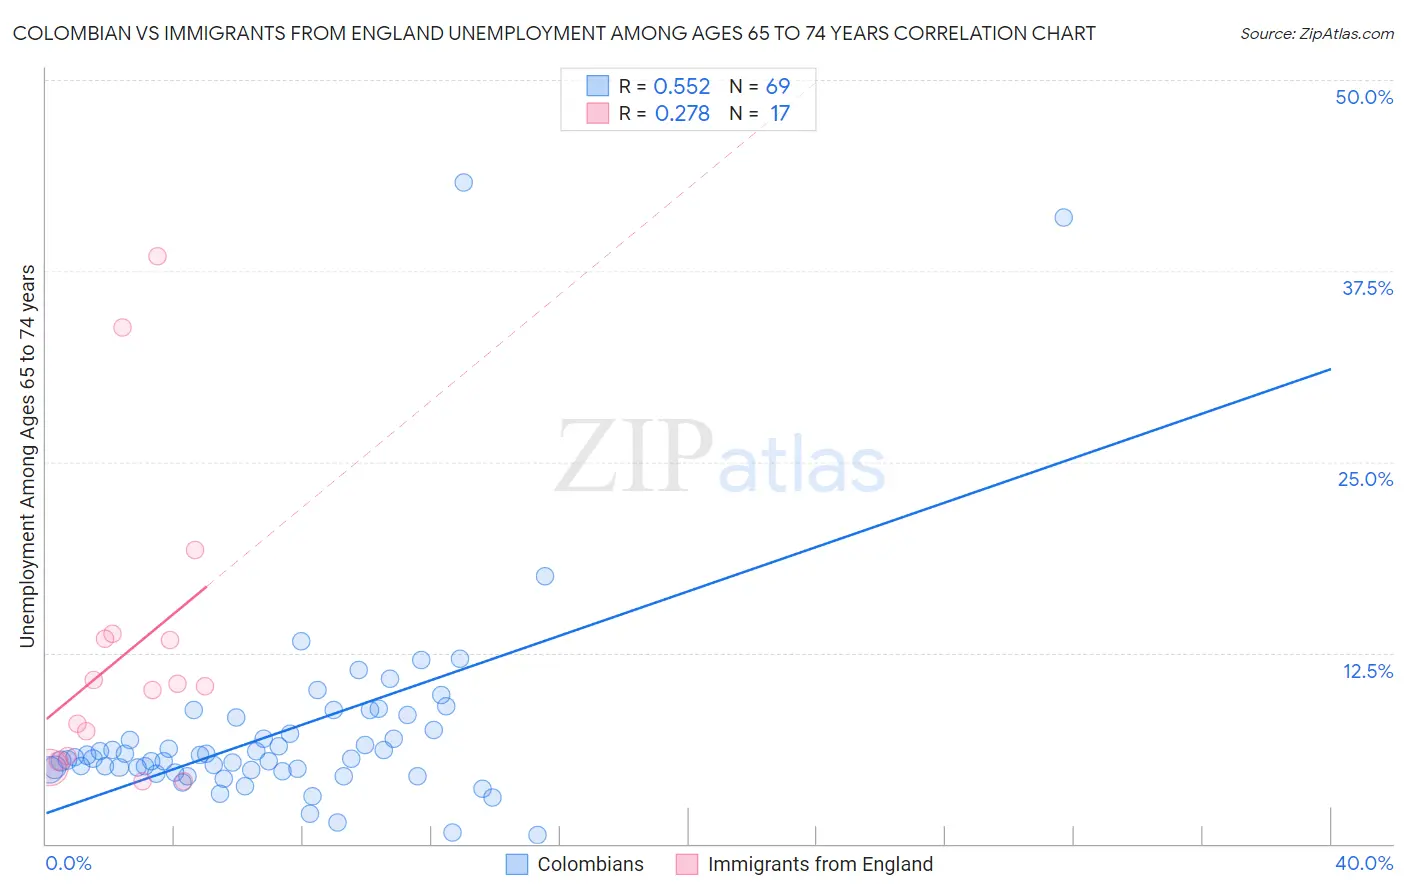
Colombian vs Immigrants from England Unemployment Among Ages 65 to 74 years Correlation Chart
The statistical analysis conducted on geographies consisting of 369,038,352 people shows a substantial positive correlation between the proportion of Colombians and unemployment rate among population between the ages 65 and 74 in the United States with a correlation coefficient (R) of 0.552 and weighted average of 5.6%. Similarly, the statistical analysis conducted on geographies consisting of 344,296,821 people shows a weak positive correlation between the proportion of Immigrants from England and unemployment rate among population between the ages 65 and 74 in the United States with a correlation coefficient (R) of 0.278 and weighted average of 5.3%, a difference of 6.0%.
Unemployment Among Ages 65 to 74 years Correlation Summary
| Measurement | Colombian | Immigrants from England |
| Minimum | 0.60% | 4.1% |
| Maximum | 43.3% | 38.5% |
| Range | 42.7% | 34.4% |
| Mean | 7.2% | 12.5% |
| Median | 5.6% | 10.3% |
| Interquartile 25% (IQ1) | 4.8% | 5.6% |
| Interquartile 75% (IQ3) | 7.9% | 13.6% |
| Interquartile Range (IQR) | 3.1% | 8.0% |
| Standard Deviation (Sample) | 6.7% | 9.8% |
| Standard Deviation (Population) | 6.7% | 9.5% |
Similar Demographics by Unemployment Among Ages 65 to 74 years
Demographics Similar to Colombians by Unemployment Among Ages 65 to 74 years
In terms of unemployment among ages 65 to 74 years, the demographic groups most similar to Colombians are Brazilian (5.6%, a difference of 0.040%), Immigrants from Brazil (5.6%, a difference of 0.060%), Immigrants from Costa Rica (5.6%, a difference of 0.080%), Immigrants from Haiti (5.6%, a difference of 0.17%), and Native Hawaiian (5.6%, a difference of 0.27%).
| Demographics | Rating | Rank | Unemployment Among Ages 65 to 74 years |
| Immigrants | Greece | 0.9 /100 | #245 | Tragic 5.6% |
| Paraguayans | 0.9 /100 | #246 | Tragic 5.6% |
| Immigrants | Immigrants | 0.9 /100 | #247 | Tragic 5.6% |
| Immigrants | Argentina | 0.9 /100 | #248 | Tragic 5.6% |
| Trinidadians and Tobagonians | 0.8 /100 | #249 | Tragic 5.6% |
| Cape Verdeans | 0.7 /100 | #250 | Tragic 5.6% |
| Brazilians | 0.5 /100 | #251 | Tragic 5.6% |
| Colombians | 0.5 /100 | #252 | Tragic 5.6% |
| Immigrants | Brazil | 0.5 /100 | #253 | Tragic 5.6% |
| Immigrants | Costa Rica | 0.5 /100 | #254 | Tragic 5.6% |
| Immigrants | Haiti | 0.4 /100 | #255 | Tragic 5.6% |
| Native Hawaiians | 0.4 /100 | #256 | Tragic 5.6% |
| Immigrants | Southern Europe | 0.3 /100 | #257 | Tragic 5.6% |
| Immigrants | Western Africa | 0.3 /100 | #258 | Tragic 5.6% |
| Sierra Leoneans | 0.2 /100 | #259 | Tragic 5.6% |
Demographics Similar to Immigrants from England by Unemployment Among Ages 65 to 74 years
In terms of unemployment among ages 65 to 74 years, the demographic groups most similar to Immigrants from England are Immigrants from Hong Kong (5.3%, a difference of 0.030%), Immigrants from North America (5.3%, a difference of 0.040%), Eastern European (5.3%, a difference of 0.040%), Immigrants from South Eastern Asia (5.3%, a difference of 0.070%), and Pakistani (5.3%, a difference of 0.090%).
| Demographics | Rating | Rank | Unemployment Among Ages 65 to 74 years |
| Immigrants | Canada | 89.0 /100 | #122 | Excellent 5.3% |
| Czechoslovakians | 88.6 /100 | #123 | Excellent 5.3% |
| Immigrants | Ukraine | 87.5 /100 | #124 | Excellent 5.3% |
| Pakistanis | 87.5 /100 | #125 | Excellent 5.3% |
| Immigrants | South Eastern Asia | 87.2 /100 | #126 | Excellent 5.3% |
| Immigrants | North America | 86.7 /100 | #127 | Excellent 5.3% |
| Immigrants | Hong Kong | 86.5 /100 | #128 | Excellent 5.3% |
| Immigrants | England | 86.2 /100 | #129 | Excellent 5.3% |
| Eastern Europeans | 85.6 /100 | #130 | Excellent 5.3% |
| Immigrants | Russia | 83.0 /100 | #131 | Excellent 5.3% |
| Koreans | 82.6 /100 | #132 | Excellent 5.3% |
| Ukrainians | 82.0 /100 | #133 | Excellent 5.3% |
| Immigrants | Panama | 81.8 /100 | #134 | Excellent 5.3% |
| Immigrants | Serbia | 81.8 /100 | #135 | Excellent 5.3% |
| Celtics | 80.8 /100 | #136 | Excellent 5.3% |