Immigrants from Europe vs Immigrants from Portugal Unemployment Among Ages 25 to 29 years
COMPARE
Immigrants from Europe
Immigrants from Portugal
Unemployment Among Ages 25 to 29 years
Unemployment Among Ages 25 to 29 years Comparison
Immigrants from Europe
Immigrants from Portugal
6.5%
UNEMPLOYMENT AMONG AGES 25 TO 29 YEARS
75.7/ 100
METRIC RATING
133rd/ 347
METRIC RANK
7.2%
UNEMPLOYMENT AMONG AGES 25 TO 29 YEARS
0.3/ 100
METRIC RATING
253rd/ 347
METRIC RANK
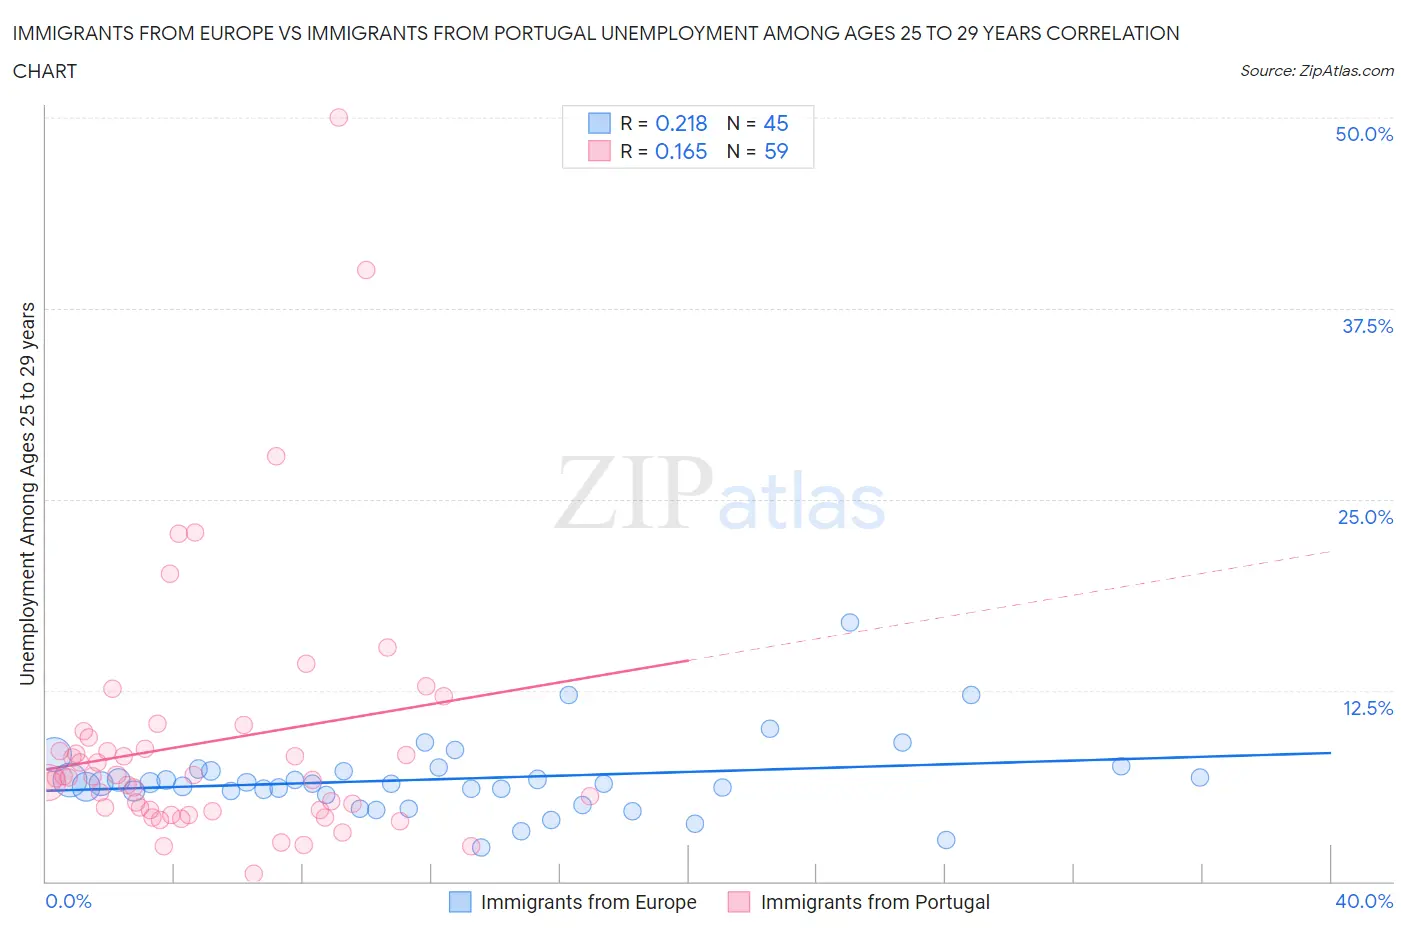
Immigrants from Europe vs Immigrants from Portugal Unemployment Among Ages 25 to 29 years Correlation Chart
The statistical analysis conducted on geographies consisting of 495,238,580 people shows a weak positive correlation between the proportion of Immigrants from Europe and unemployment rate among population between the ages 25 and 29 in the United States with a correlation coefficient (R) of 0.218 and weighted average of 6.5%. Similarly, the statistical analysis conducted on geographies consisting of 169,562,653 people shows a poor positive correlation between the proportion of Immigrants from Portugal and unemployment rate among population between the ages 25 and 29 in the United States with a correlation coefficient (R) of 0.165 and weighted average of 7.2%, a difference of 10.7%.
Unemployment Among Ages 25 to 29 years Correlation Summary
| Measurement | Immigrants from Europe | Immigrants from Portugal |
| Minimum | 2.2% | 0.50% |
| Maximum | 16.9% | 50.0% |
| Range | 14.7% | 49.5% |
| Mean | 6.7% | 9.1% |
| Median | 6.4% | 6.8% |
| Interquartile 25% (IQ1) | 5.8% | 4.7% |
| Interquartile 75% (IQ3) | 7.3% | 9.4% |
| Interquartile Range (IQR) | 1.5% | 4.7% |
| Standard Deviation (Sample) | 2.5% | 8.6% |
| Standard Deviation (Population) | 2.5% | 8.5% |
Similar Demographics by Unemployment Among Ages 25 to 29 years
Demographics Similar to Immigrants from Europe by Unemployment Among Ages 25 to 29 years
In terms of unemployment among ages 25 to 29 years, the demographic groups most similar to Immigrants from Europe are Immigrants from Vietnam (6.5%, a difference of 0.010%), Immigrants from Croatia (6.5%, a difference of 0.010%), Northern European (6.5%, a difference of 0.030%), Polish (6.5%, a difference of 0.080%), and Eastern European (6.5%, a difference of 0.14%).
| Demographics | Rating | Rank | Unemployment Among Ages 25 to 29 years |
| Brazilians | 81.9 /100 | #126 | Excellent 6.5% |
| Dutch | 80.6 /100 | #127 | Excellent 6.5% |
| Immigrants | Chile | 80.5 /100 | #128 | Excellent 6.5% |
| Sri Lankans | 80.3 /100 | #129 | Excellent 6.5% |
| Immigrants | Peru | 79.9 /100 | #130 | Good 6.5% |
| Immigrants | Afghanistan | 79.2 /100 | #131 | Good 6.5% |
| Poles | 76.6 /100 | #132 | Good 6.5% |
| Immigrants | Europe | 75.7 /100 | #133 | Good 6.5% |
| Immigrants | Vietnam | 75.6 /100 | #134 | Good 6.5% |
| Immigrants | Croatia | 75.5 /100 | #135 | Good 6.5% |
| Northern Europeans | 75.4 /100 | #136 | Good 6.5% |
| Eastern Europeans | 74.1 /100 | #137 | Good 6.5% |
| Immigrants | Belgium | 73.8 /100 | #138 | Good 6.5% |
| Austrians | 73.8 /100 | #139 | Good 6.5% |
| Immigrants | Pakistan | 73.8 /100 | #140 | Good 6.5% |
Demographics Similar to Immigrants from Portugal by Unemployment Among Ages 25 to 29 years
In terms of unemployment among ages 25 to 29 years, the demographic groups most similar to Immigrants from Portugal are Ghanaian (7.2%, a difference of 0.15%), Immigrants from Cameroon (7.2%, a difference of 0.21%), Sierra Leonean (7.2%, a difference of 0.32%), Mexican American Indian (7.3%, a difference of 0.40%), and Portuguese (7.2%, a difference of 0.58%).
| Demographics | Rating | Rank | Unemployment Among Ages 25 to 29 years |
| Immigrants | Uzbekistan | 0.7 /100 | #246 | Tragic 7.2% |
| Immigrants | Guatemala | 0.7 /100 | #247 | Tragic 7.2% |
| Sub-Saharan Africans | 0.6 /100 | #248 | Tragic 7.2% |
| Seminole | 0.6 /100 | #249 | Tragic 7.2% |
| Delaware | 0.5 /100 | #250 | Tragic 7.2% |
| Portuguese | 0.5 /100 | #251 | Tragic 7.2% |
| Sierra Leoneans | 0.4 /100 | #252 | Tragic 7.2% |
| Immigrants | Portugal | 0.3 /100 | #253 | Tragic 7.2% |
| Ghanaians | 0.3 /100 | #254 | Tragic 7.2% |
| Immigrants | Cameroon | 0.3 /100 | #255 | Tragic 7.2% |
| Mexican American Indians | 0.3 /100 | #256 | Tragic 7.3% |
| Assyrians/Chaldeans/Syriacs | 0.2 /100 | #257 | Tragic 7.3% |
| Ottawa | 0.1 /100 | #258 | Tragic 7.3% |
| Cree | 0.1 /100 | #259 | Tragic 7.3% |
| Americans | 0.1 /100 | #260 | Tragic 7.4% |