Choctaw vs Mexican American Indian Unemployment Among Ages 65 to 74 years
COMPARE
Choctaw
Mexican American Indian
Unemployment Among Ages 65 to 74 years
Unemployment Among Ages 65 to 74 years Comparison
Choctaw
Mexican American Indians
5.1%
UNEMPLOYMENT AMONG AGES 65 TO 74 YEARS
99.8/ 100
METRIC RATING
48th/ 347
METRIC RANK
5.7%
UNEMPLOYMENT AMONG AGES 65 TO 74 YEARS
0.1/ 100
METRIC RATING
278th/ 347
METRIC RANK
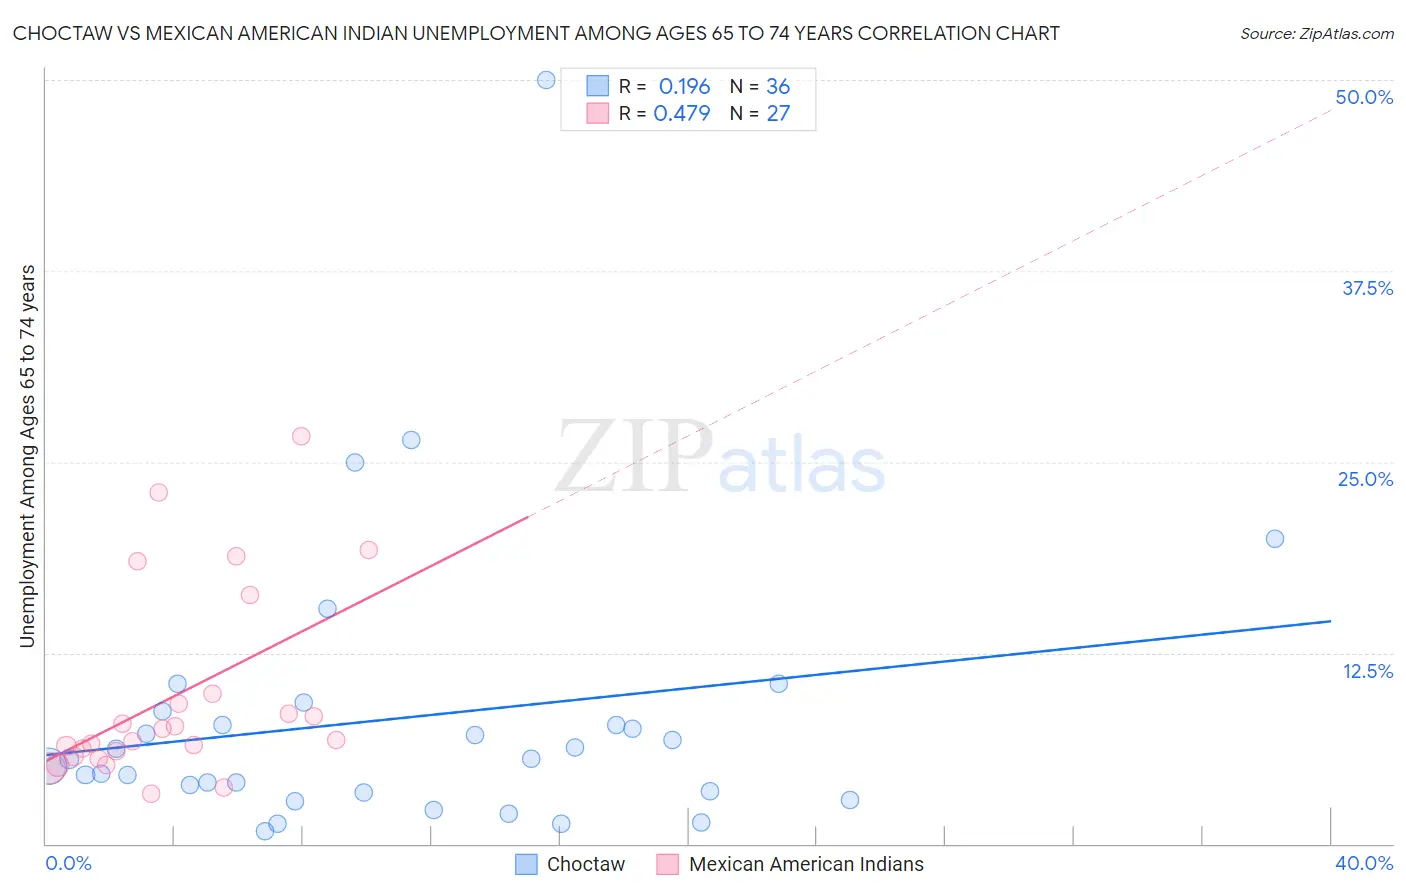
Choctaw vs Mexican American Indian Unemployment Among Ages 65 to 74 years Correlation Chart
The statistical analysis conducted on geographies consisting of 239,014,089 people shows a poor positive correlation between the proportion of Choctaw and unemployment rate among population between the ages 65 and 74 in the United States with a correlation coefficient (R) of 0.196 and weighted average of 5.1%. Similarly, the statistical analysis conducted on geographies consisting of 285,699,139 people shows a moderate positive correlation between the proportion of Mexican American Indians and unemployment rate among population between the ages 65 and 74 in the United States with a correlation coefficient (R) of 0.479 and weighted average of 5.7%, a difference of 11.5%.
Unemployment Among Ages 65 to 74 years Correlation Summary
| Measurement | Choctaw | Mexican American Indian |
| Minimum | 0.86% | 3.3% |
| Maximum | 50.0% | 26.7% |
| Range | 49.1% | 23.4% |
| Mean | 8.2% | 9.6% |
| Median | 5.5% | 6.8% |
| Interquartile 25% (IQ1) | 3.4% | 5.7% |
| Interquartile 75% (IQ3) | 8.2% | 9.8% |
| Interquartile Range (IQR) | 4.9% | 4.1% |
| Standard Deviation (Sample) | 9.4% | 6.3% |
| Standard Deviation (Population) | 9.2% | 6.2% |
Similar Demographics by Unemployment Among Ages 65 to 74 years
Demographics Similar to Choctaw by Unemployment Among Ages 65 to 74 years
In terms of unemployment among ages 65 to 74 years, the demographic groups most similar to Choctaw are Immigrants from Austria (5.1%, a difference of 0.010%), Immigrants from Uganda (5.1%, a difference of 0.16%), Immigrants from Zimbabwe (5.1%, a difference of 0.18%), Immigrants from Kazakhstan (5.1%, a difference of 0.20%), and Immigrants from Kenya (5.1%, a difference of 0.21%).
| Demographics | Rating | Rank | Unemployment Among Ages 65 to 74 years |
| Ugandans | 99.9 /100 | #41 | Exceptional 5.1% |
| Jordanians | 99.9 /100 | #42 | Exceptional 5.1% |
| Assyrians/Chaldeans/Syriacs | 99.9 /100 | #43 | Exceptional 5.1% |
| Immigrants | India | 99.9 /100 | #44 | Exceptional 5.1% |
| Sioux | 99.8 /100 | #45 | Exceptional 5.1% |
| Immigrants | Kenya | 99.8 /100 | #46 | Exceptional 5.1% |
| Immigrants | Uganda | 99.8 /100 | #47 | Exceptional 5.1% |
| Choctaw | 99.8 /100 | #48 | Exceptional 5.1% |
| Immigrants | Austria | 99.8 /100 | #49 | Exceptional 5.1% |
| Immigrants | Zimbabwe | 99.7 /100 | #50 | Exceptional 5.1% |
| Immigrants | Kazakhstan | 99.7 /100 | #51 | Exceptional 5.1% |
| Europeans | 99.6 /100 | #52 | Exceptional 5.1% |
| Immigrants | Ethiopia | 99.6 /100 | #53 | Exceptional 5.1% |
| Immigrants | Nicaragua | 99.6 /100 | #54 | Exceptional 5.1% |
| Carpatho Rusyns | 99.6 /100 | #55 | Exceptional 5.1% |
Demographics Similar to Mexican American Indians by Unemployment Among Ages 65 to 74 years
In terms of unemployment among ages 65 to 74 years, the demographic groups most similar to Mexican American Indians are Immigrants from South America (5.7%, a difference of 0.020%), Immigrants from Norway (5.7%, a difference of 0.16%), Moroccan (5.7%, a difference of 0.16%), Somali (5.7%, a difference of 0.19%), and Immigrants from Liberia (5.7%, a difference of 0.24%).
| Demographics | Rating | Rank | Unemployment Among Ages 65 to 74 years |
| Belizeans | 0.1 /100 | #271 | Tragic 5.7% |
| Yaqui | 0.1 /100 | #272 | Tragic 5.7% |
| Bahamians | 0.1 /100 | #273 | Tragic 5.7% |
| Immigrants | Guyana | 0.1 /100 | #274 | Tragic 5.7% |
| Immigrants | Liberia | 0.1 /100 | #275 | Tragic 5.7% |
| Somalis | 0.1 /100 | #276 | Tragic 5.7% |
| Immigrants | South America | 0.1 /100 | #277 | Tragic 5.7% |
| Mexican American Indians | 0.1 /100 | #278 | Tragic 5.7% |
| Immigrants | Norway | 0.1 /100 | #279 | Tragic 5.7% |
| Moroccans | 0.1 /100 | #280 | Tragic 5.7% |
| Immigrants | West Indies | 0.1 /100 | #281 | Tragic 5.7% |
| Ottawa | 0.1 /100 | #282 | Tragic 5.7% |
| Cypriots | 0.1 /100 | #283 | Tragic 5.7% |
| Chippewa | 0.1 /100 | #284 | Tragic 5.7% |
| Immigrants | Sierra Leone | 0.1 /100 | #285 | Tragic 5.7% |