Chippewa vs Immigrants from Sierra Leone Unemployment Among Ages 60 to 64 years
COMPARE
Chippewa
Immigrants from Sierra Leone
Unemployment Among Ages 60 to 64 years
Unemployment Among Ages 60 to 64 years Comparison
Chippewa
Immigrants from Sierra Leone
4.9%
UNEMPLOYMENT AMONG AGES 60 TO 64 YEARS
17.3/ 100
METRIC RATING
207th/ 347
METRIC RANK
5.0%
UNEMPLOYMENT AMONG AGES 60 TO 64 YEARS
3.1/ 100
METRIC RATING
236th/ 347
METRIC RANK
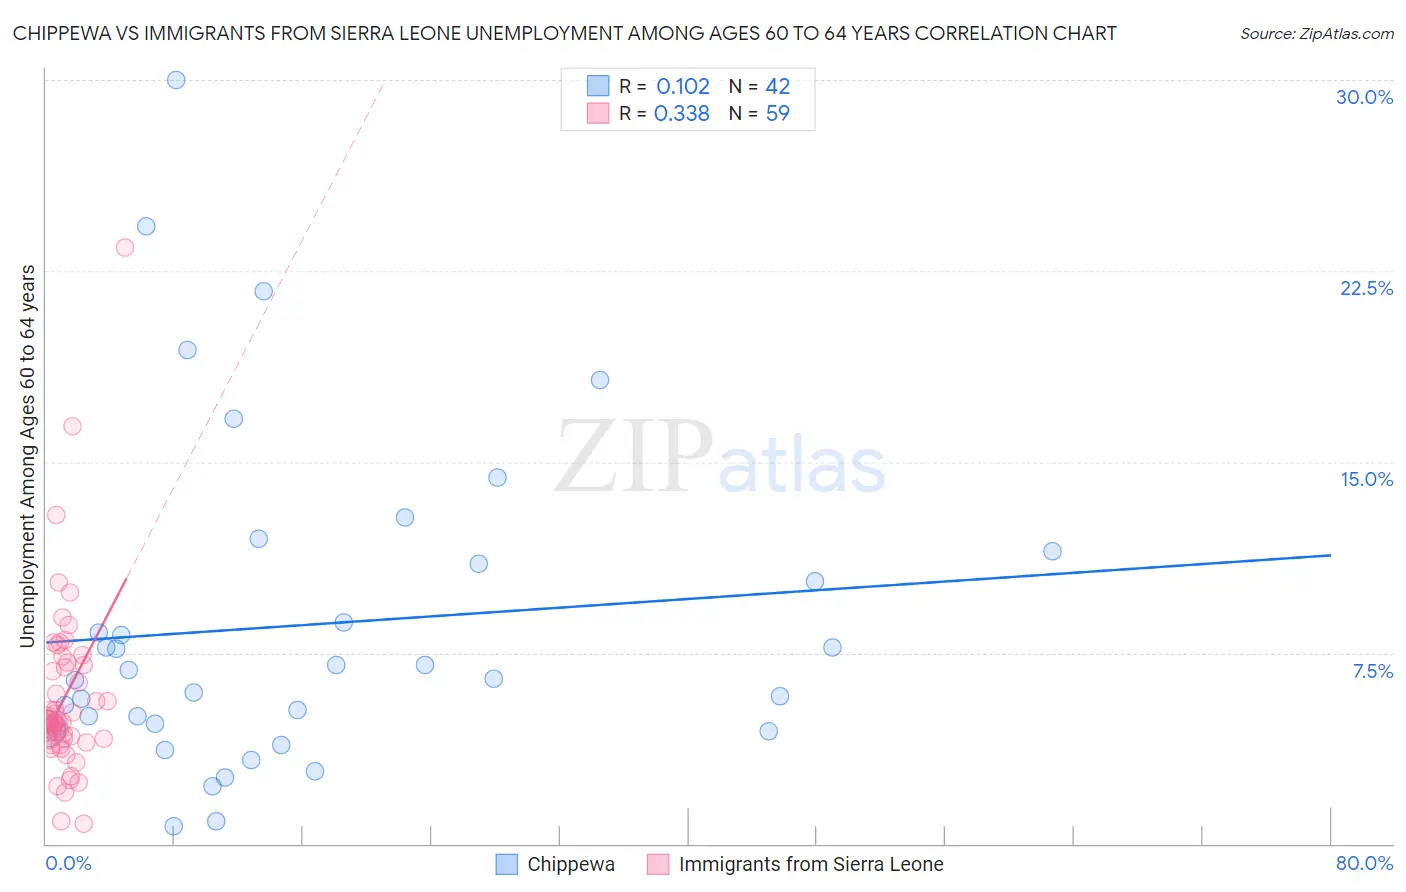
Chippewa vs Immigrants from Sierra Leone Unemployment Among Ages 60 to 64 years Correlation Chart
The statistical analysis conducted on geographies consisting of 196,878,650 people shows a poor positive correlation between the proportion of Chippewa and unemployment rate among population between the ages 60 and 64 in the United States with a correlation coefficient (R) of 0.102 and weighted average of 4.9%. Similarly, the statistical analysis conducted on geographies consisting of 98,057,510 people shows a mild positive correlation between the proportion of Immigrants from Sierra Leone and unemployment rate among population between the ages 60 and 64 in the United States with a correlation coefficient (R) of 0.338 and weighted average of 5.0%, a difference of 1.6%.
Unemployment Among Ages 60 to 64 years Correlation Summary
| Measurement | Chippewa | Immigrants from Sierra Leone |
| Minimum | 0.70% | 0.80% |
| Maximum | 30.0% | 23.4% |
| Range | 29.3% | 22.6% |
| Mean | 8.6% | 5.7% |
| Median | 6.7% | 4.8% |
| Interquartile 25% (IQ1) | 4.5% | 4.1% |
| Interquartile 75% (IQ3) | 11.0% | 7.0% |
| Interquartile Range (IQR) | 6.5% | 2.9% |
| Standard Deviation (Sample) | 6.4% | 3.5% |
| Standard Deviation (Population) | 6.3% | 3.5% |
Similar Demographics by Unemployment Among Ages 60 to 64 years
Demographics Similar to Chippewa by Unemployment Among Ages 60 to 64 years
In terms of unemployment among ages 60 to 64 years, the demographic groups most similar to Chippewa are Immigrants from Indonesia (4.9%, a difference of 0.010%), New Zealander (4.9%, a difference of 0.010%), German Russian (4.9%, a difference of 0.030%), Sierra Leonean (4.9%, a difference of 0.050%), and Cherokee (4.9%, a difference of 0.070%).
| Demographics | Rating | Rank | Unemployment Among Ages 60 to 64 years |
| Immigrants | Czechoslovakia | 23.5 /100 | #200 | Fair 4.9% |
| Colombians | 22.7 /100 | #201 | Fair 4.9% |
| Immigrants | Western Africa | 20.6 /100 | #202 | Fair 4.9% |
| Uruguayans | 19.9 /100 | #203 | Poor 4.9% |
| Russians | 18.9 /100 | #204 | Poor 4.9% |
| Immigrants | Indonesia | 17.4 /100 | #205 | Poor 4.9% |
| New Zealanders | 17.4 /100 | #206 | Poor 4.9% |
| Chippewa | 17.3 /100 | #207 | Poor 4.9% |
| German Russians | 16.8 /100 | #208 | Poor 4.9% |
| Sierra Leoneans | 16.5 /100 | #209 | Poor 4.9% |
| Cherokee | 16.1 /100 | #210 | Poor 4.9% |
| Blackfeet | 15.7 /100 | #211 | Poor 4.9% |
| Moroccans | 15.0 /100 | #212 | Poor 4.9% |
| Eastern Europeans | 14.3 /100 | #213 | Poor 4.9% |
| Immigrants | Russia | 13.7 /100 | #214 | Poor 4.9% |
Demographics Similar to Immigrants from Sierra Leone by Unemployment Among Ages 60 to 64 years
In terms of unemployment among ages 60 to 64 years, the demographic groups most similar to Immigrants from Sierra Leone are Immigrants from Western Asia (5.0%, a difference of 0.040%), Immigrants from Poland (5.0%, a difference of 0.040%), Delaware (5.0%, a difference of 0.13%), Ghanaian (5.0%, a difference of 0.22%), and Iranian (5.0%, a difference of 0.26%).
| Demographics | Rating | Rank | Unemployment Among Ages 60 to 64 years |
| Africans | 5.9 /100 | #229 | Tragic 5.0% |
| Immigrants | Denmark | 5.8 /100 | #230 | Tragic 5.0% |
| Tohono O'odham | 5.7 /100 | #231 | Tragic 5.0% |
| Immigrants | Eastern Asia | 4.7 /100 | #232 | Tragic 5.0% |
| Immigrants | Greece | 4.6 /100 | #233 | Tragic 5.0% |
| Iranians | 4.2 /100 | #234 | Tragic 5.0% |
| Delaware | 3.6 /100 | #235 | Tragic 5.0% |
| Immigrants | Sierra Leone | 3.1 /100 | #236 | Tragic 5.0% |
| Immigrants | Western Asia | 3.0 /100 | #237 | Tragic 5.0% |
| Immigrants | Poland | 3.0 /100 | #238 | Tragic 5.0% |
| Ghanaians | 2.4 /100 | #239 | Tragic 5.0% |
| Immigrants | Croatia | 2.2 /100 | #240 | Tragic 5.0% |
| Indians (Asian) | 2.2 /100 | #241 | Tragic 5.0% |
| Argentineans | 2.1 /100 | #242 | Tragic 5.0% |
| Immigrants | Philippines | 1.9 /100 | #243 | Tragic 5.0% |