Chippewa vs Spaniard Unemployment Among Ages 25 to 29 years
COMPARE
Chippewa
Spaniard
Unemployment Among Ages 25 to 29 years
Unemployment Among Ages 25 to 29 years Comparison
Chippewa
Spaniards
7.8%
UNEMPLOYMENT AMONG AGES 25 TO 29 YEARS
0.0/ 100
METRIC RATING
292nd/ 347
METRIC RANK
6.9%
UNEMPLOYMENT AMONG AGES 25 TO 29 YEARS
7.7/ 100
METRIC RATING
222nd/ 347
METRIC RANK
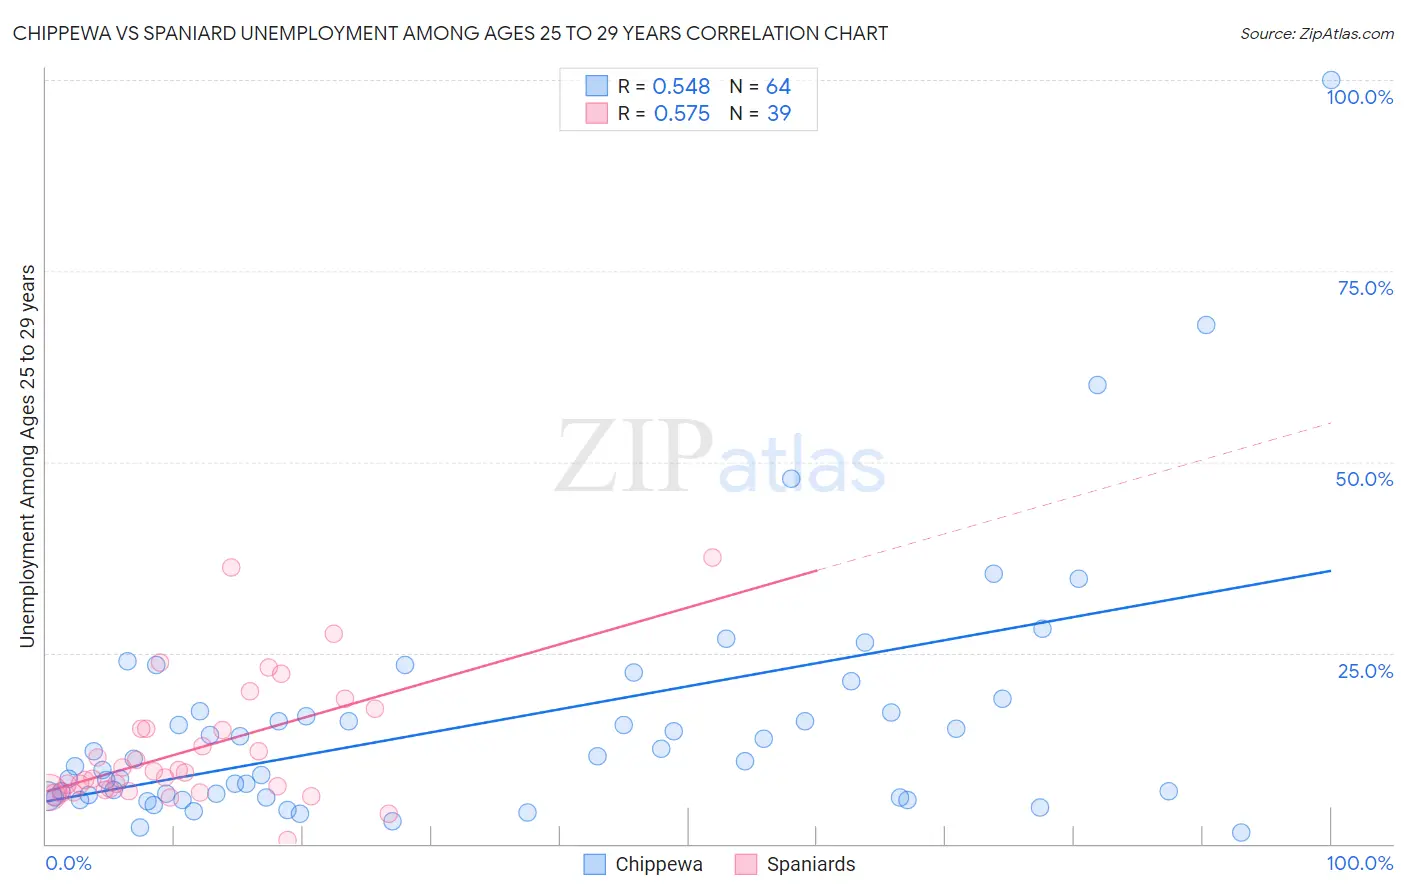
Chippewa vs Spaniard Unemployment Among Ages 25 to 29 years Correlation Chart
The statistical analysis conducted on geographies consisting of 206,101,614 people shows a substantial positive correlation between the proportion of Chippewa and unemployment rate among population between the ages 25 and 29 in the United States with a correlation coefficient (R) of 0.548 and weighted average of 7.8%. Similarly, the statistical analysis conducted on geographies consisting of 418,176,283 people shows a substantial positive correlation between the proportion of Spaniards and unemployment rate among population between the ages 25 and 29 in the United States with a correlation coefficient (R) of 0.575 and weighted average of 6.9%, a difference of 12.4%.
Unemployment Among Ages 25 to 29 years Correlation Summary
| Measurement | Chippewa | Spaniard |
| Minimum | 1.4% | 0.50% |
| Maximum | 100.0% | 37.4% |
| Range | 98.6% | 36.9% |
| Mean | 15.8% | 12.4% |
| Median | 10.9% | 9.4% |
| Interquartile 25% (IQ1) | 6.2% | 6.9% |
| Interquartile 75% (IQ3) | 17.3% | 15.1% |
| Interquartile Range (IQR) | 11.1% | 8.2% |
| Standard Deviation (Sample) | 16.6% | 8.3% |
| Standard Deviation (Population) | 16.4% | 8.2% |
Similar Demographics by Unemployment Among Ages 25 to 29 years
Demographics Similar to Chippewa by Unemployment Among Ages 25 to 29 years
In terms of unemployment among ages 25 to 29 years, the demographic groups most similar to Chippewa are Immigrants from Belize (7.8%, a difference of 0.050%), Trinidadian and Tobagonian (7.8%, a difference of 0.33%), Hispanic or Latino (7.7%, a difference of 0.41%), Armenian (7.7%, a difference of 0.80%), and Comanche (7.8%, a difference of 0.80%).
| Demographics | Rating | Rank | Unemployment Among Ages 25 to 29 years |
| Senegalese | 0.0 /100 | #285 | Tragic 7.6% |
| Vietnamese | 0.0 /100 | #286 | Tragic 7.6% |
| Immigrants | Mexico | 0.0 /100 | #287 | Tragic 7.6% |
| Africans | 0.0 /100 | #288 | Tragic 7.6% |
| Belizeans | 0.0 /100 | #289 | Tragic 7.7% |
| Armenians | 0.0 /100 | #290 | Tragic 7.7% |
| Hispanics or Latinos | 0.0 /100 | #291 | Tragic 7.7% |
| Chippewa | 0.0 /100 | #292 | Tragic 7.8% |
| Immigrants | Belize | 0.0 /100 | #293 | Tragic 7.8% |
| Trinidadians and Tobagonians | 0.0 /100 | #294 | Tragic 7.8% |
| Comanche | 0.0 /100 | #295 | Tragic 7.8% |
| Immigrants | West Indies | 0.0 /100 | #296 | Tragic 7.8% |
| Blackfeet | 0.0 /100 | #297 | Tragic 7.9% |
| Immigrants | Trinidad and Tobago | 0.0 /100 | #298 | Tragic 7.9% |
| Barbadians | 0.0 /100 | #299 | Tragic 7.9% |
Demographics Similar to Spaniards by Unemployment Among Ages 25 to 29 years
In terms of unemployment among ages 25 to 29 years, the demographic groups most similar to Spaniards are Celtic (6.9%, a difference of 0.010%), Immigrants (6.9%, a difference of 0.34%), Israeli (6.9%, a difference of 0.39%), French (6.9%, a difference of 0.51%), and White/Caucasian (6.9%, a difference of 0.52%).
| Demographics | Rating | Rank | Unemployment Among Ages 25 to 29 years |
| Spanish | 14.4 /100 | #215 | Poor 6.8% |
| Slovaks | 14.3 /100 | #216 | Poor 6.8% |
| Ute | 13.4 /100 | #217 | Poor 6.8% |
| Immigrants | Austria | 12.3 /100 | #218 | Poor 6.8% |
| Whites/Caucasians | 10.6 /100 | #219 | Poor 6.9% |
| French | 10.5 /100 | #220 | Poor 6.9% |
| Israelis | 9.8 /100 | #221 | Tragic 6.9% |
| Spaniards | 7.7 /100 | #222 | Tragic 6.9% |
| Celtics | 7.6 /100 | #223 | Tragic 6.9% |
| Immigrants | Immigrants | 6.2 /100 | #224 | Tragic 6.9% |
| Japanese | 5.4 /100 | #225 | Tragic 6.9% |
| Immigrants | Liberia | 4.8 /100 | #226 | Tragic 7.0% |
| Salvadorans | 4.4 /100 | #227 | Tragic 7.0% |
| Immigrants | Panama | 4.2 /100 | #228 | Tragic 7.0% |
| Bermudans | 3.8 /100 | #229 | Tragic 7.0% |