Chinese vs Jordanian Unemployment Among Ages 25 to 29 years
COMPARE
Chinese
Jordanian
Unemployment Among Ages 25 to 29 years
Unemployment Among Ages 25 to 29 years Comparison
Chinese
Jordanians
6.1%
UNEMPLOYMENT AMONG AGES 25 TO 29 YEARS
99.6/ 100
METRIC RATING
32nd/ 347
METRIC RANK
6.1%
UNEMPLOYMENT AMONG AGES 25 TO 29 YEARS
99.3/ 100
METRIC RATING
42nd/ 347
METRIC RANK
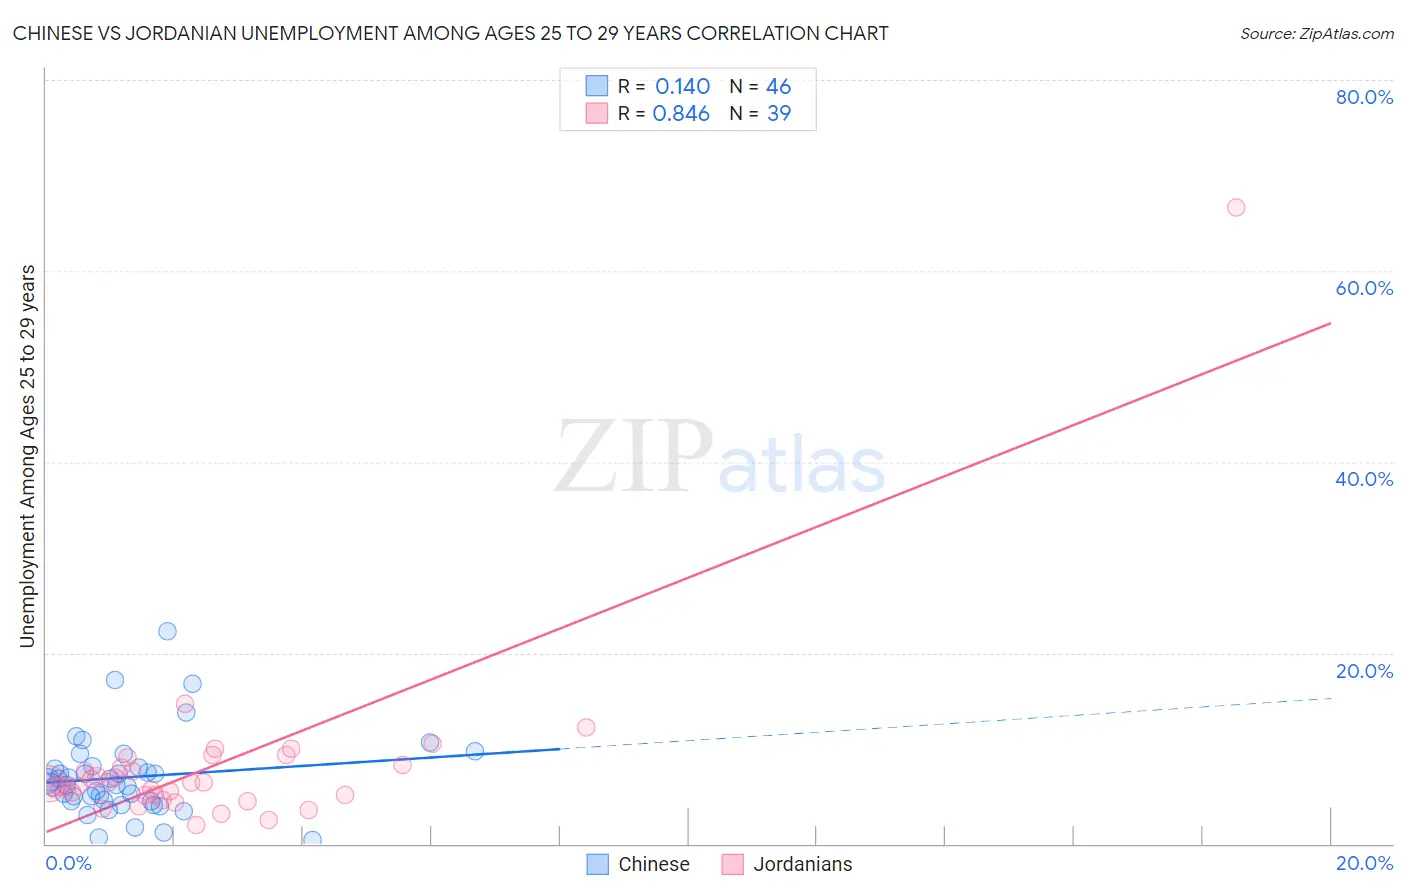
Chinese vs Jordanian Unemployment Among Ages 25 to 29 years Correlation Chart
The statistical analysis conducted on geographies consisting of 63,787,303 people shows a poor positive correlation between the proportion of Chinese and unemployment rate among population between the ages 25 and 29 in the United States with a correlation coefficient (R) of 0.140 and weighted average of 6.1%. Similarly, the statistical analysis conducted on geographies consisting of 164,069,311 people shows a very strong positive correlation between the proportion of Jordanians and unemployment rate among population between the ages 25 and 29 in the United States with a correlation coefficient (R) of 0.846 and weighted average of 6.1%, a difference of 1.0%.
Unemployment Among Ages 25 to 29 years Correlation Summary
| Measurement | Chinese | Jordanian |
| Minimum | 0.40% | 2.0% |
| Maximum | 22.2% | 66.7% |
| Range | 21.8% | 64.7% |
| Mean | 7.0% | 8.1% |
| Median | 6.3% | 6.2% |
| Interquartile 25% (IQ1) | 4.5% | 5.1% |
| Interquartile 75% (IQ3) | 8.0% | 8.2% |
| Interquartile Range (IQR) | 3.5% | 3.1% |
| Standard Deviation (Sample) | 4.2% | 10.0% |
| Standard Deviation (Population) | 4.2% | 9.8% |
Demographics Similar to Chinese and Jordanians by Unemployment Among Ages 25 to 29 years
In terms of unemployment among ages 25 to 29 years, the demographic groups most similar to Chinese are Yugoslavian (6.1%, a difference of 0.10%), Filipino (6.1%, a difference of 0.35%), Immigrants from Morocco (6.1%, a difference of 0.36%), Immigrants from Zimbabwe (6.1%, a difference of 0.40%), and Taiwanese (6.1%, a difference of 0.42%). Similarly, the demographic groups most similar to Jordanians are Fijian (6.1%, a difference of 0.030%), Immigrants from Kenya (6.1%, a difference of 0.070%), Czech (6.2%, a difference of 0.13%), Mongolian (6.2%, a difference of 0.18%), and Indonesian (6.1%, a difference of 0.20%).
| Demographics | Rating | Rank | Unemployment Among Ages 25 to 29 years |
| Immigrants | Zaire | 99.7 /100 | #27 | Exceptional 6.0% |
| Danes | 99.7 /100 | #28 | Exceptional 6.0% |
| Immigrants | South Central Asia | 99.7 /100 | #29 | Exceptional 6.1% |
| Bulgarians | 99.7 /100 | #30 | Exceptional 6.1% |
| Filipinos | 99.7 /100 | #31 | Exceptional 6.1% |
| Chinese | 99.6 /100 | #32 | Exceptional 6.1% |
| Yugoslavians | 99.6 /100 | #33 | Exceptional 6.1% |
| Immigrants | Morocco | 99.5 /100 | #34 | Exceptional 6.1% |
| Immigrants | Zimbabwe | 99.5 /100 | #35 | Exceptional 6.1% |
| Taiwanese | 99.5 /100 | #36 | Exceptional 6.1% |
| Immigrants | Serbia | 99.5 /100 | #37 | Exceptional 6.1% |
| Ethiopians | 99.4 /100 | #38 | Exceptional 6.1% |
| Indonesians | 99.3 /100 | #39 | Exceptional 6.1% |
| Immigrants | Kenya | 99.3 /100 | #40 | Exceptional 6.1% |
| Fijians | 99.3 /100 | #41 | Exceptional 6.1% |
| Jordanians | 99.3 /100 | #42 | Exceptional 6.1% |
| Czechs | 99.2 /100 | #43 | Exceptional 6.2% |
| Mongolians | 99.2 /100 | #44 | Exceptional 6.2% |
| Venezuelans | 99.1 /100 | #45 | Exceptional 6.2% |
| Immigrants | Lithuania | 99.0 /100 | #46 | Exceptional 6.2% |
| Latvians | 99.0 /100 | #47 | Exceptional 6.2% |