Chinese vs Yaqui Unemployment Among Ages 25 to 29 years
COMPARE
Chinese
Yaqui
Unemployment Among Ages 25 to 29 years
Unemployment Among Ages 25 to 29 years Comparison
Chinese
Yaqui
6.1%
UNEMPLOYMENT AMONG AGES 25 TO 29 YEARS
99.6/ 100
METRIC RATING
32nd/ 347
METRIC RANK
7.1%
UNEMPLOYMENT AMONG AGES 25 TO 29 YEARS
1.0/ 100
METRIC RATING
243rd/ 347
METRIC RANK
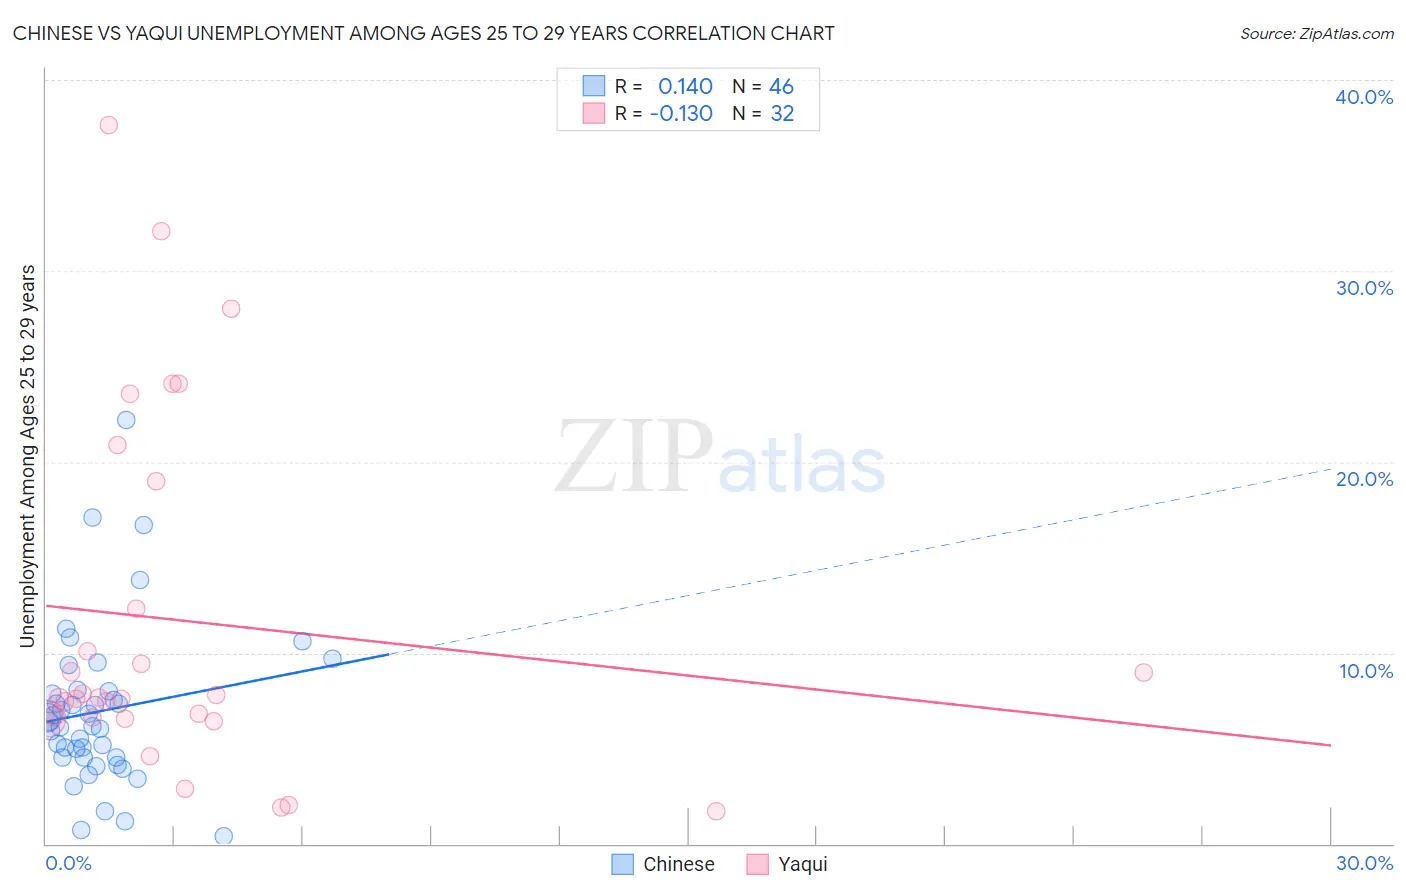
Chinese vs Yaqui Unemployment Among Ages 25 to 29 years Correlation Chart
The statistical analysis conducted on geographies consisting of 63,787,303 people shows a poor positive correlation between the proportion of Chinese and unemployment rate among population between the ages 25 and 29 in the United States with a correlation coefficient (R) of 0.140 and weighted average of 6.1%. Similarly, the statistical analysis conducted on geographies consisting of 106,484,946 people shows a poor negative correlation between the proportion of Yaqui and unemployment rate among population between the ages 25 and 29 in the United States with a correlation coefficient (R) of -0.130 and weighted average of 7.1%, a difference of 17.0%.
Unemployment Among Ages 25 to 29 years Correlation Summary
| Measurement | Chinese | Yaqui |
| Minimum | 0.40% | 1.7% |
| Maximum | 22.2% | 37.6% |
| Range | 21.8% | 35.9% |
| Mean | 7.0% | 11.7% |
| Median | 6.3% | 7.7% |
| Interquartile 25% (IQ1) | 4.5% | 6.6% |
| Interquartile 75% (IQ3) | 8.0% | 15.7% |
| Interquartile Range (IQR) | 3.5% | 9.1% |
| Standard Deviation (Sample) | 4.2% | 9.3% |
| Standard Deviation (Population) | 4.2% | 9.1% |
Similar Demographics by Unemployment Among Ages 25 to 29 years
Demographics Similar to Chinese by Unemployment Among Ages 25 to 29 years
In terms of unemployment among ages 25 to 29 years, the demographic groups most similar to Chinese are Yugoslavian (6.1%, a difference of 0.10%), Filipino (6.1%, a difference of 0.35%), Immigrants from Morocco (6.1%, a difference of 0.36%), Immigrants from Zimbabwe (6.1%, a difference of 0.40%), and Taiwanese (6.1%, a difference of 0.42%).
| Demographics | Rating | Rank | Unemployment Among Ages 25 to 29 years |
| New Zealanders | 99.8 /100 | #25 | Exceptional 6.0% |
| Immigrants | Eastern Africa | 99.8 /100 | #26 | Exceptional 6.0% |
| Immigrants | Zaire | 99.7 /100 | #27 | Exceptional 6.0% |
| Danes | 99.7 /100 | #28 | Exceptional 6.0% |
| Immigrants | South Central Asia | 99.7 /100 | #29 | Exceptional 6.1% |
| Bulgarians | 99.7 /100 | #30 | Exceptional 6.1% |
| Filipinos | 99.7 /100 | #31 | Exceptional 6.1% |
| Chinese | 99.6 /100 | #32 | Exceptional 6.1% |
| Yugoslavians | 99.6 /100 | #33 | Exceptional 6.1% |
| Immigrants | Morocco | 99.5 /100 | #34 | Exceptional 6.1% |
| Immigrants | Zimbabwe | 99.5 /100 | #35 | Exceptional 6.1% |
| Taiwanese | 99.5 /100 | #36 | Exceptional 6.1% |
| Immigrants | Serbia | 99.5 /100 | #37 | Exceptional 6.1% |
| Ethiopians | 99.4 /100 | #38 | Exceptional 6.1% |
| Indonesians | 99.3 /100 | #39 | Exceptional 6.1% |
Demographics Similar to Yaqui by Unemployment Among Ages 25 to 29 years
In terms of unemployment among ages 25 to 29 years, the demographic groups most similar to Yaqui are Nonimmigrants (7.1%, a difference of 0.030%), Spanish American Indian (7.1%, a difference of 0.13%), Guatemalan (7.1%, a difference of 0.13%), Immigrants from Sierra Leone (7.1%, a difference of 0.39%), and Native Hawaiian (7.1%, a difference of 0.43%).
| Demographics | Rating | Rank | Unemployment Among Ages 25 to 29 years |
| Cape Verdeans | 1.9 /100 | #236 | Tragic 7.0% |
| Puget Sound Salish | 1.8 /100 | #237 | Tragic 7.1% |
| Hondurans | 1.8 /100 | #238 | Tragic 7.1% |
| Potawatomi | 1.3 /100 | #239 | Tragic 7.1% |
| Native Hawaiians | 1.3 /100 | #240 | Tragic 7.1% |
| Immigrants | Sierra Leone | 1.3 /100 | #241 | Tragic 7.1% |
| Spanish American Indians | 1.1 /100 | #242 | Tragic 7.1% |
| Yaqui | 1.0 /100 | #243 | Tragic 7.1% |
| Immigrants | Nonimmigrants | 0.9 /100 | #244 | Tragic 7.1% |
| Guatemalans | 0.9 /100 | #245 | Tragic 7.1% |
| Immigrants | Uzbekistan | 0.7 /100 | #246 | Tragic 7.2% |
| Immigrants | Guatemala | 0.7 /100 | #247 | Tragic 7.2% |
| Sub-Saharan Africans | 0.6 /100 | #248 | Tragic 7.2% |
| Seminole | 0.6 /100 | #249 | Tragic 7.2% |
| Delaware | 0.5 /100 | #250 | Tragic 7.2% |