Chinese vs British West Indian Unemployment Among Ages 65 to 74 years
COMPARE
Chinese
British West Indian
Unemployment Among Ages 65 to 74 years
Unemployment Among Ages 65 to 74 years Comparison
Chinese
British West Indians
4.4%
UNEMPLOYMENT AMONG AGES 65 TO 74 YEARS
100.0/ 100
METRIC RATING
2nd/ 347
METRIC RANK
5.8%
UNEMPLOYMENT AMONG AGES 65 TO 74 YEARS
0.0/ 100
METRIC RATING
307th/ 347
METRIC RANK
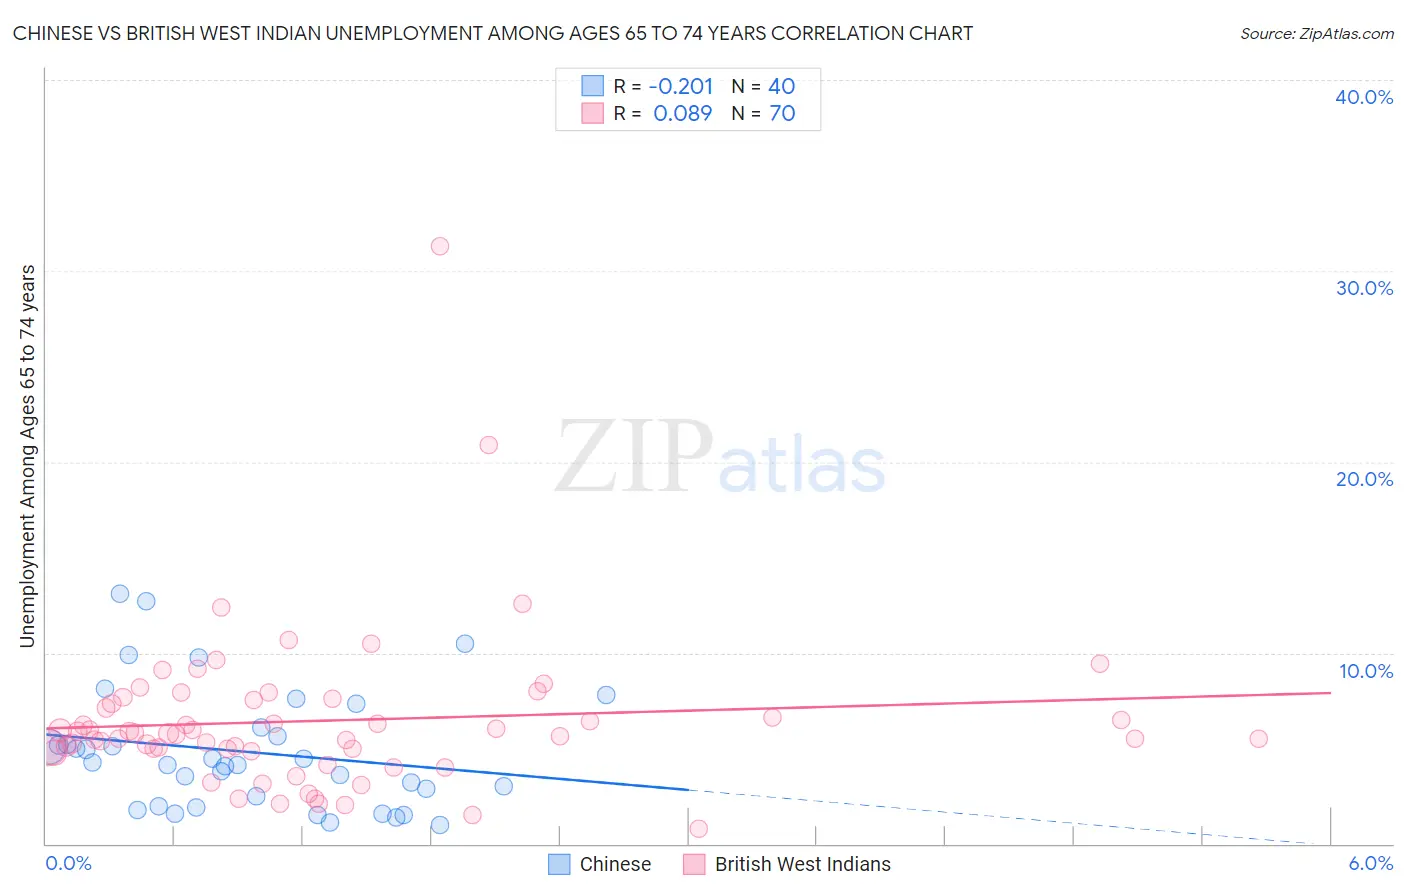
Chinese vs British West Indian Unemployment Among Ages 65 to 74 years Correlation Chart
The statistical analysis conducted on geographies consisting of 62,031,641 people shows a weak negative correlation between the proportion of Chinese and unemployment rate among population between the ages 65 and 74 in the United States with a correlation coefficient (R) of -0.201 and weighted average of 4.4%. Similarly, the statistical analysis conducted on geographies consisting of 144,276,982 people shows a slight positive correlation between the proportion of British West Indians and unemployment rate among population between the ages 65 and 74 in the United States with a correlation coefficient (R) of 0.089 and weighted average of 5.8%, a difference of 31.2%.
Unemployment Among Ages 65 to 74 years Correlation Summary
| Measurement | Chinese | British West Indian |
| Minimum | 1.0% | 0.80% |
| Maximum | 13.1% | 31.3% |
| Range | 12.1% | 30.5% |
| Mean | 4.8% | 6.4% |
| Median | 4.2% | 5.8% |
| Interquartile 25% (IQ1) | 2.2% | 5.0% |
| Interquartile 75% (IQ3) | 5.8% | 7.5% |
| Interquartile Range (IQR) | 3.6% | 2.6% |
| Standard Deviation (Sample) | 3.1% | 4.2% |
| Standard Deviation (Population) | 3.1% | 4.2% |
Similar Demographics by Unemployment Among Ages 65 to 74 years
Demographics Similar to Chinese by Unemployment Among Ages 65 to 74 years
In terms of unemployment among ages 65 to 74 years, the demographic groups most similar to Chinese are Fijian (4.5%, a difference of 1.6%), Tsimshian (4.6%, a difference of 3.1%), Sudanese (4.6%, a difference of 3.5%), Immigrants from Cuba (4.6%, a difference of 4.0%), and Indonesian (4.7%, a difference of 5.5%).
| Demographics | Rating | Rank | Unemployment Among Ages 65 to 74 years |
| Hmong | 100.0 /100 | #1 | Exceptional 4.2% |
| Chinese | 100.0 /100 | #2 | Exceptional 4.4% |
| Fijians | 100.0 /100 | #3 | Exceptional 4.5% |
| Tsimshian | 100.0 /100 | #4 | Exceptional 4.6% |
| Sudanese | 100.0 /100 | #5 | Exceptional 4.6% |
| Immigrants | Cuba | 100.0 /100 | #6 | Exceptional 4.6% |
| Indonesians | 100.0 /100 | #7 | Exceptional 4.7% |
| Comanche | 100.0 /100 | #8 | Exceptional 4.7% |
| Chickasaw | 100.0 /100 | #9 | Exceptional 4.7% |
| Osage | 100.0 /100 | #10 | Exceptional 4.7% |
| Immigrants | Congo | 100.0 /100 | #11 | Exceptional 4.7% |
| Tongans | 100.0 /100 | #12 | Exceptional 4.7% |
| Lumbee | 100.0 /100 | #13 | Exceptional 4.8% |
| Cubans | 100.0 /100 | #14 | Exceptional 4.8% |
| Immigrants | North Macedonia | 100.0 /100 | #15 | Exceptional 4.8% |
Demographics Similar to British West Indians by Unemployment Among Ages 65 to 74 years
In terms of unemployment among ages 65 to 74 years, the demographic groups most similar to British West Indians are Cheyenne (5.8%, a difference of 0.0%), Mexican (5.8%, a difference of 0.010%), Arapaho (5.8%, a difference of 0.020%), Salvadoran (5.8%, a difference of 0.020%), and Liberian (5.8%, a difference of 0.050%).
| Demographics | Rating | Rank | Unemployment Among Ages 65 to 74 years |
| Ecuadorians | 0.0 /100 | #300 | Tragic 5.8% |
| Armenians | 0.0 /100 | #301 | Tragic 5.8% |
| Liberians | 0.0 /100 | #302 | Tragic 5.8% |
| Arapaho | 0.0 /100 | #303 | Tragic 5.8% |
| Salvadorans | 0.0 /100 | #304 | Tragic 5.8% |
| Mexicans | 0.0 /100 | #305 | Tragic 5.8% |
| Cheyenne | 0.0 /100 | #306 | Tragic 5.8% |
| British West Indians | 0.0 /100 | #307 | Tragic 5.8% |
| Guatemalans | 0.0 /100 | #308 | Tragic 5.8% |
| Immigrants | Ecuador | 0.0 /100 | #309 | Tragic 5.8% |
| Immigrants | Bangladesh | 0.0 /100 | #310 | Tragic 5.9% |
| Venezuelans | 0.0 /100 | #311 | Tragic 5.9% |
| Hispanics or Latinos | 0.0 /100 | #312 | Tragic 5.9% |
| Vietnamese | 0.0 /100 | #313 | Tragic 5.9% |
| Immigrants | Venezuela | 0.0 /100 | #314 | Tragic 5.9% |