Chilean vs Immigrants from Barbados Unemployment Among Ages 60 to 64 years
COMPARE
Chilean
Immigrants from Barbados
Unemployment Among Ages 60 to 64 years
Unemployment Among Ages 60 to 64 years Comparison
Chileans
Immigrants from Barbados
4.8%
UNEMPLOYMENT AMONG AGES 60 TO 64 YEARS
72.6/ 100
METRIC RATING
154th/ 347
METRIC RANK
5.4%
UNEMPLOYMENT AMONG AGES 60 TO 64 YEARS
0.0/ 100
METRIC RATING
300th/ 347
METRIC RANK
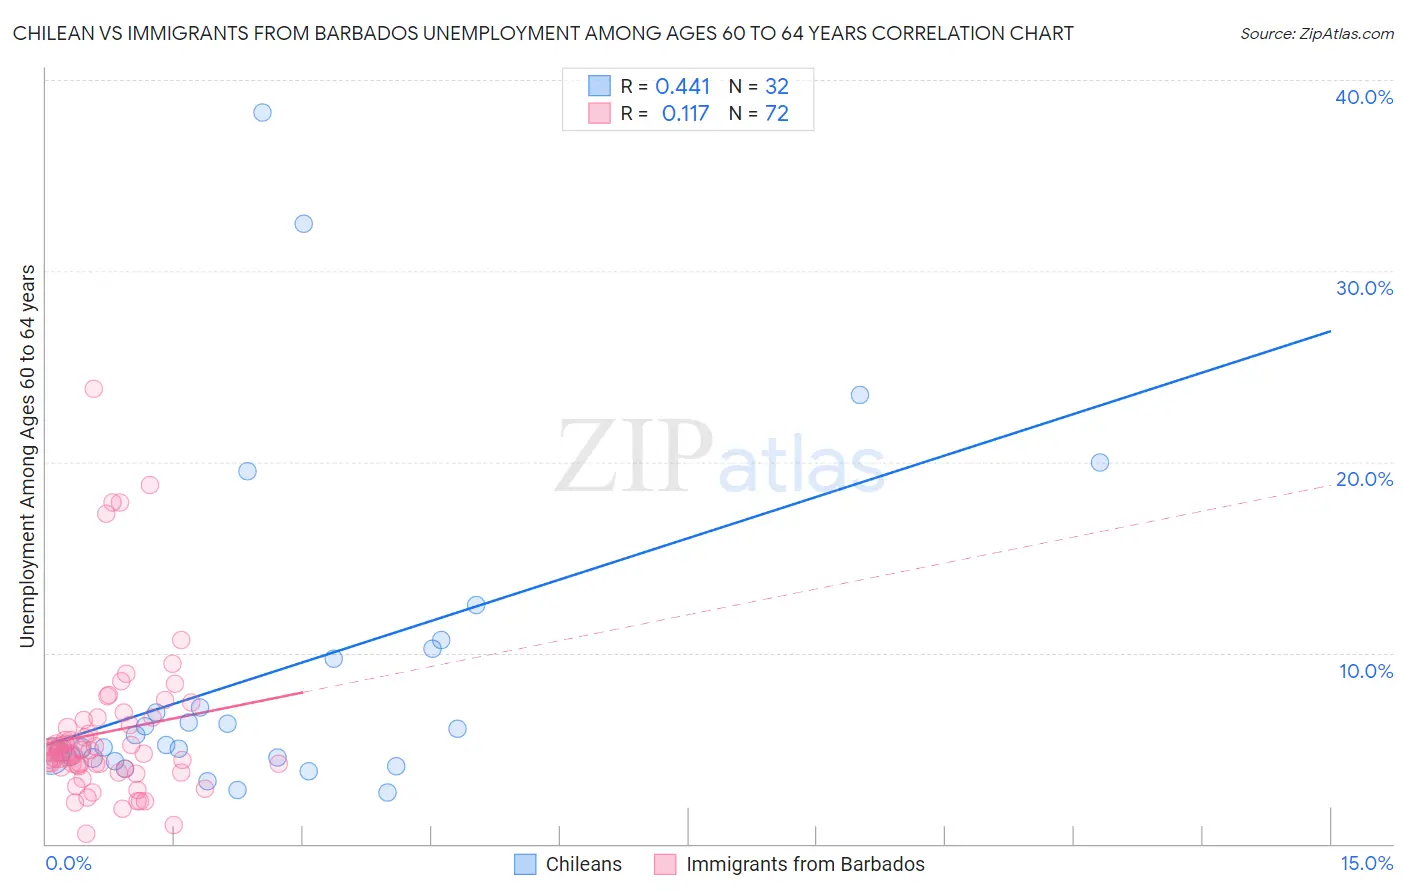
Chilean vs Immigrants from Barbados Unemployment Among Ages 60 to 64 years Correlation Chart
The statistical analysis conducted on geographies consisting of 243,499,371 people shows a moderate positive correlation between the proportion of Chileans and unemployment rate among population between the ages 60 and 64 in the United States with a correlation coefficient (R) of 0.441 and weighted average of 4.8%. Similarly, the statistical analysis conducted on geographies consisting of 109,730,537 people shows a poor positive correlation between the proportion of Immigrants from Barbados and unemployment rate among population between the ages 60 and 64 in the United States with a correlation coefficient (R) of 0.117 and weighted average of 5.4%, a difference of 11.4%.
Unemployment Among Ages 60 to 64 years Correlation Summary
| Measurement | Chilean | Immigrants from Barbados |
| Minimum | 2.7% | 0.50% |
| Maximum | 38.3% | 23.8% |
| Range | 35.6% | 23.3% |
| Mean | 9.0% | 5.8% |
| Median | 5.4% | 4.8% |
| Interquartile 25% (IQ1) | 4.5% | 4.0% |
| Interquartile 75% (IQ3) | 9.9% | 6.3% |
| Interquartile Range (IQR) | 5.5% | 2.3% |
| Standard Deviation (Sample) | 8.6% | 4.2% |
| Standard Deviation (Population) | 8.5% | 4.1% |
Similar Demographics by Unemployment Among Ages 60 to 64 years
Demographics Similar to Chileans by Unemployment Among Ages 60 to 64 years
In terms of unemployment among ages 60 to 64 years, the demographic groups most similar to Chileans are Filipino (4.8%, a difference of 0.020%), Bolivian (4.8%, a difference of 0.13%), American (4.8%, a difference of 0.14%), Immigrants from Bolivia (4.8%, a difference of 0.15%), and Laotian (4.8%, a difference of 0.25%).
| Demographics | Rating | Rank | Unemployment Among Ages 60 to 64 years |
| Mongolians | 81.2 /100 | #147 | Excellent 4.8% |
| Latvians | 79.1 /100 | #148 | Good 4.8% |
| Arabs | 78.8 /100 | #149 | Good 4.8% |
| Immigrants | Italy | 78.7 /100 | #150 | Good 4.8% |
| Immigrants | South Africa | 78.5 /100 | #151 | Good 4.8% |
| Americans | 75.7 /100 | #152 | Good 4.8% |
| Bolivians | 75.5 /100 | #153 | Good 4.8% |
| Chileans | 72.6 /100 | #154 | Good 4.8% |
| Filipinos | 72.1 /100 | #155 | Good 4.8% |
| Immigrants | Bolivia | 69.2 /100 | #156 | Good 4.8% |
| Laotians | 66.8 /100 | #157 | Good 4.8% |
| Immigrants | Taiwan | 66.0 /100 | #158 | Good 4.8% |
| Spanish | 65.5 /100 | #159 | Good 4.8% |
| Australians | 65.3 /100 | #160 | Good 4.8% |
| Immigrants | Norway | 65.1 /100 | #161 | Good 4.8% |
Demographics Similar to Immigrants from Barbados by Unemployment Among Ages 60 to 64 years
In terms of unemployment among ages 60 to 64 years, the demographic groups most similar to Immigrants from Barbados are Immigrants from Jamaica (5.4%, a difference of 0.020%), Immigrants from El Salvador (5.4%, a difference of 0.030%), Immigrants from Central America (5.4%, a difference of 0.080%), Osage (5.4%, a difference of 0.13%), and Barbadian (5.4%, a difference of 0.43%).
| Demographics | Rating | Rank | Unemployment Among Ages 60 to 64 years |
| Immigrants | Israel | 0.0 /100 | #293 | Tragic 5.3% |
| Blacks/African Americans | 0.0 /100 | #294 | Tragic 5.3% |
| Armenians | 0.0 /100 | #295 | Tragic 5.3% |
| Jamaicans | 0.0 /100 | #296 | Tragic 5.3% |
| Osage | 0.0 /100 | #297 | Tragic 5.4% |
| Immigrants | Central America | 0.0 /100 | #298 | Tragic 5.4% |
| Immigrants | El Salvador | 0.0 /100 | #299 | Tragic 5.4% |
| Immigrants | Barbados | 0.0 /100 | #300 | Tragic 5.4% |
| Immigrants | Jamaica | 0.0 /100 | #301 | Tragic 5.4% |
| Barbadians | 0.0 /100 | #302 | Tragic 5.4% |
| Bahamians | 0.0 /100 | #303 | Tragic 5.4% |
| Immigrants | Mexico | 0.0 /100 | #304 | Tragic 5.4% |
| Cypriots | 0.0 /100 | #305 | Tragic 5.4% |
| Immigrants | Dominica | 0.0 /100 | #306 | Tragic 5.4% |
| Immigrants | Guyana | 0.0 /100 | #307 | Tragic 5.4% |