Chickasaw vs Immigrants from Sri Lanka Unemployment Among Women with Children Under 6 years
COMPARE
Chickasaw
Immigrants from Sri Lanka
Unemployment Among Women with Children Under 6 years
Unemployment Among Women with Children Under 6 years Comparison
Chickasaw
Immigrants from Sri Lanka
9.0%
UNEMPLOYMENT AMONG WOMEN WITH CHILDREN UNDER 6 YEARS
0.0/ 100
METRIC RATING
301st/ 347
METRIC RANK
6.9%
UNEMPLOYMENT AMONG WOMEN WITH CHILDREN UNDER 6 YEARS
99.8/ 100
METRIC RATING
60th/ 347
METRIC RANK
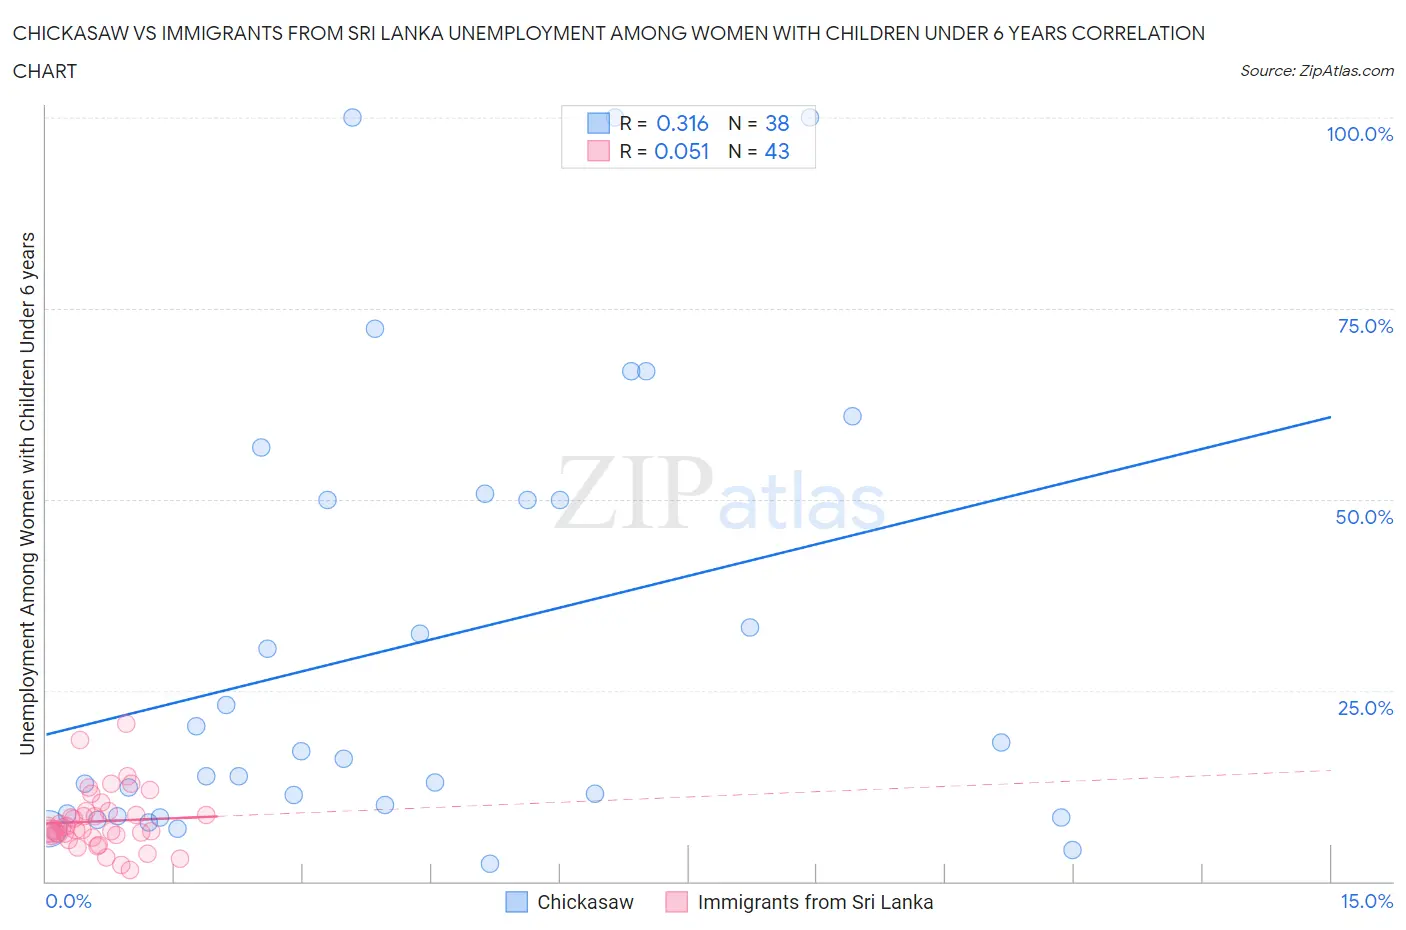
Chickasaw vs Immigrants from Sri Lanka Unemployment Among Women with Children Under 6 years Correlation Chart
The statistical analysis conducted on geographies consisting of 128,741,531 people shows a mild positive correlation between the proportion of Chickasaw and unemployment rate among women with children under the age of 6 in the United States with a correlation coefficient (R) of 0.316 and weighted average of 9.0%. Similarly, the statistical analysis conducted on geographies consisting of 131,652,229 people shows a slight positive correlation between the proportion of Immigrants from Sri Lanka and unemployment rate among women with children under the age of 6 in the United States with a correlation coefficient (R) of 0.051 and weighted average of 6.9%, a difference of 30.3%.
Unemployment Among Women with Children Under 6 years Correlation Summary
| Measurement | Chickasaw | Immigrants from Sri Lanka |
| Minimum | 2.2% | 1.5% |
| Maximum | 100.0% | 20.7% |
| Range | 97.8% | 19.2% |
| Mean | 31.1% | 7.9% |
| Median | 16.5% | 6.7% |
| Interquartile 25% (IQ1) | 8.8% | 6.1% |
| Interquartile 75% (IQ3) | 50.0% | 9.2% |
| Interquartile Range (IQR) | 41.2% | 3.1% |
| Standard Deviation (Sample) | 28.9% | 3.9% |
| Standard Deviation (Population) | 28.5% | 3.8% |
Similar Demographics by Unemployment Among Women with Children Under 6 years
Demographics Similar to Chickasaw by Unemployment Among Women with Children Under 6 years
In terms of unemployment among women with children under 6 years, the demographic groups most similar to Chickasaw are Creek (8.9%, a difference of 0.53%), Immigrants from Jamaica (8.9%, a difference of 0.62%), Tlingit-Haida (8.9%, a difference of 0.83%), Hispanic or Latino (9.0%, a difference of 0.89%), and Immigrants from West Indies (9.0%, a difference of 0.91%).
| Demographics | Rating | Rank | Unemployment Among Women with Children Under 6 years |
| Immigrants | Nonimmigrants | 0.0 /100 | #294 | Tragic 8.8% |
| Immigrants | Central America | 0.0 /100 | #295 | Tragic 8.9% |
| Immigrants | Dominican Republic | 0.0 /100 | #296 | Tragic 8.9% |
| Mexicans | 0.0 /100 | #297 | Tragic 8.9% |
| Tlingit-Haida | 0.0 /100 | #298 | Tragic 8.9% |
| Immigrants | Jamaica | 0.0 /100 | #299 | Tragic 8.9% |
| Creek | 0.0 /100 | #300 | Tragic 8.9% |
| Chickasaw | 0.0 /100 | #301 | Tragic 9.0% |
| Hispanics or Latinos | 0.0 /100 | #302 | Tragic 9.0% |
| Immigrants | West Indies | 0.0 /100 | #303 | Tragic 9.0% |
| Immigrants | Mexico | 0.0 /100 | #304 | Tragic 9.1% |
| Alaskan Athabascans | 0.0 /100 | #305 | Tragic 9.1% |
| Pueblo | 0.0 /100 | #306 | Tragic 9.1% |
| Dominicans | 0.0 /100 | #307 | Tragic 9.1% |
| Immigrants | Micronesia | 0.0 /100 | #308 | Tragic 9.1% |
Demographics Similar to Immigrants from Sri Lanka by Unemployment Among Women with Children Under 6 years
In terms of unemployment among women with children under 6 years, the demographic groups most similar to Immigrants from Sri Lanka are Immigrants from Serbia (6.9%, a difference of 0.080%), Immigrants from Turkey (6.9%, a difference of 0.14%), Icelander (6.9%, a difference of 0.37%), Immigrants from France (6.9%, a difference of 0.37%), and Immigrants from Ethiopia (6.9%, a difference of 0.38%).
| Demographics | Rating | Rank | Unemployment Among Women with Children Under 6 years |
| Chinese | 99.9 /100 | #53 | Exceptional 6.8% |
| Immigrants | Latvia | 99.9 /100 | #54 | Exceptional 6.8% |
| Immigrants | Ukraine | 99.8 /100 | #55 | Exceptional 6.8% |
| Immigrants | Ethiopia | 99.8 /100 | #56 | Exceptional 6.9% |
| Icelanders | 99.8 /100 | #57 | Exceptional 6.9% |
| Immigrants | Turkey | 99.8 /100 | #58 | Exceptional 6.9% |
| Immigrants | Serbia | 99.8 /100 | #59 | Exceptional 6.9% |
| Immigrants | Sri Lanka | 99.8 /100 | #60 | Exceptional 6.9% |
| Immigrants | France | 99.7 /100 | #61 | Exceptional 6.9% |
| Somalis | 99.7 /100 | #62 | Exceptional 6.9% |
| Maltese | 99.7 /100 | #63 | Exceptional 6.9% |
| Tongans | 99.7 /100 | #64 | Exceptional 6.9% |
| Immigrants | Kuwait | 99.7 /100 | #65 | Exceptional 6.9% |
| Immigrants | Belgium | 99.6 /100 | #66 | Exceptional 6.9% |
| Immigrants | Netherlands | 99.5 /100 | #67 | Exceptional 7.0% |