Cherokee vs Immigrants from Zaire Unemployment Among Seniors over 65 years
COMPARE
Cherokee
Immigrants from Zaire
Unemployment Among Seniors over 65 years
Unemployment Among Seniors over 65 years Comparison
Cherokee
Immigrants from Zaire
5.1%
UNEMPLOYMENT AMONG SENIORS OVER 65 YEARS
81.6/ 100
METRIC RATING
141st/ 347
METRIC RANK
4.5%
UNEMPLOYMENT AMONG SENIORS OVER 65 YEARS
100.0/ 100
METRIC RATING
10th/ 347
METRIC RANK
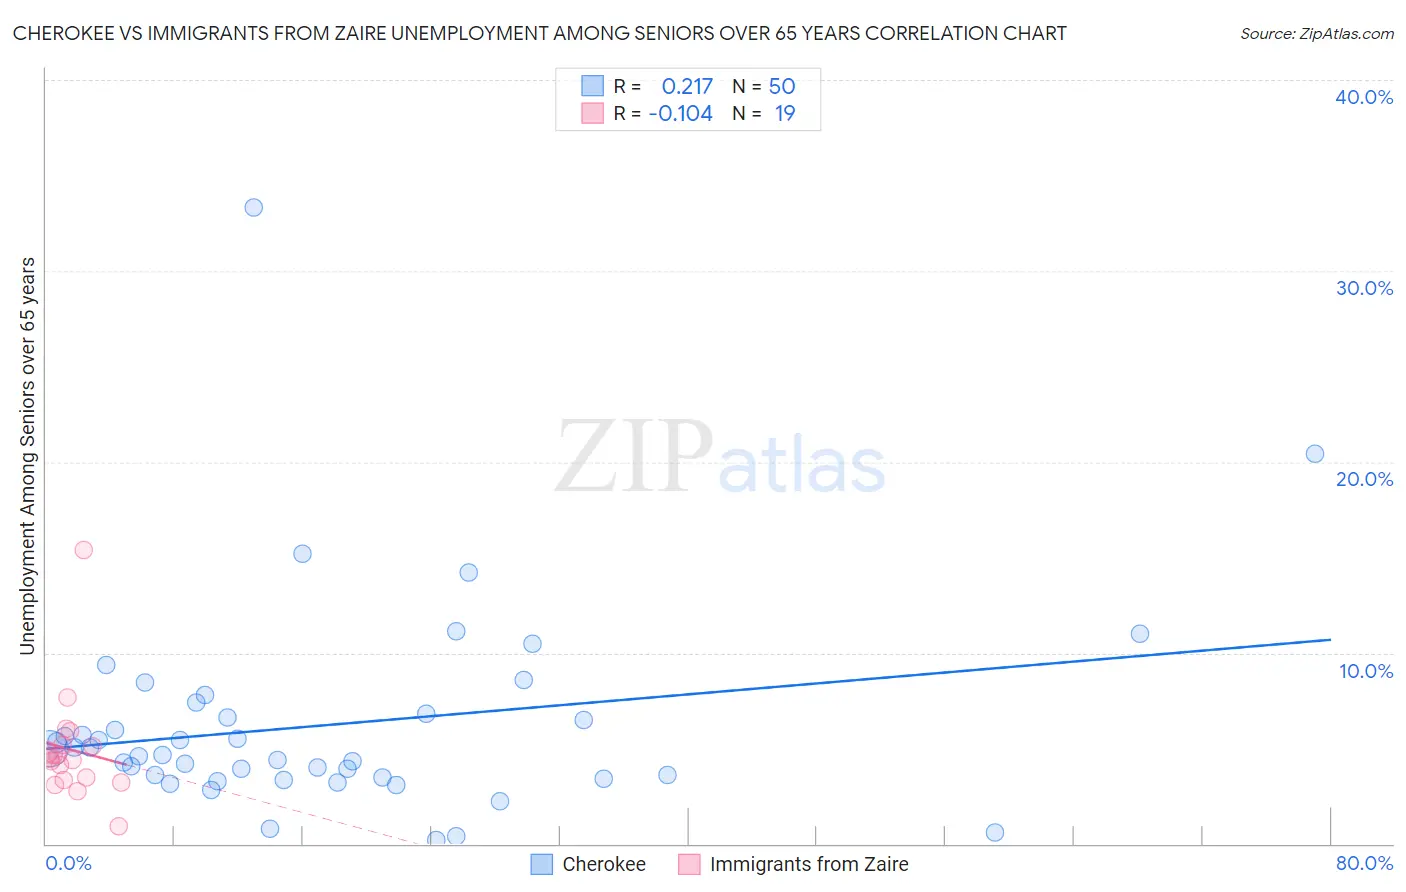
Cherokee vs Immigrants from Zaire Unemployment Among Seniors over 65 years Correlation Chart
The statistical analysis conducted on geographies consisting of 416,373,281 people shows a weak positive correlation between the proportion of Cherokee and unemployment rate amomg seniors over the age of 65 in the United States with a correlation coefficient (R) of 0.217 and weighted average of 5.1%. Similarly, the statistical analysis conducted on geographies consisting of 103,549,085 people shows a poor negative correlation between the proportion of Immigrants from Zaire and unemployment rate amomg seniors over the age of 65 in the United States with a correlation coefficient (R) of -0.104 and weighted average of 4.5%, a difference of 11.9%.
Unemployment Among Seniors over 65 years Correlation Summary
| Measurement | Cherokee | Immigrants from Zaire |
| Minimum | 0.20% | 0.90% |
| Maximum | 33.3% | 15.4% |
| Range | 33.1% | 14.5% |
| Mean | 6.2% | 4.9% |
| Median | 4.8% | 4.5% |
| Interquartile 25% (IQ1) | 3.5% | 3.3% |
| Interquartile 75% (IQ3) | 6.8% | 5.2% |
| Interquartile Range (IQR) | 3.3% | 1.8% |
| Standard Deviation (Sample) | 5.4% | 2.9% |
| Standard Deviation (Population) | 5.4% | 2.8% |
Similar Demographics by Unemployment Among Seniors over 65 years
Demographics Similar to Cherokee by Unemployment Among Seniors over 65 years
In terms of unemployment among seniors over 65 years, the demographic groups most similar to Cherokee are Immigrants from Indonesia (5.1%, a difference of 0.030%), Senegalese (5.1%, a difference of 0.060%), Polish (5.1%, a difference of 0.070%), Immigrants from Panama (5.1%, a difference of 0.080%), and Immigrants from Chile (5.1%, a difference of 0.080%).
| Demographics | Rating | Rank | Unemployment Among Seniors over 65 years |
| Turks | 84.9 /100 | #134 | Excellent 5.1% |
| Ukrainians | 84.4 /100 | #135 | Excellent 5.1% |
| Whites/Caucasians | 84.4 /100 | #136 | Excellent 5.1% |
| Arabs | 84.3 /100 | #137 | Excellent 5.1% |
| New Zealanders | 83.2 /100 | #138 | Excellent 5.1% |
| Immigrants | Panama | 83.0 /100 | #139 | Excellent 5.1% |
| Immigrants | Chile | 83.0 /100 | #140 | Excellent 5.1% |
| Cherokee | 81.6 /100 | #141 | Excellent 5.1% |
| Immigrants | Indonesia | 81.0 /100 | #142 | Excellent 5.1% |
| Senegalese | 80.4 /100 | #143 | Excellent 5.1% |
| Poles | 80.3 /100 | #144 | Excellent 5.1% |
| Spanish | 78.8 /100 | #145 | Good 5.1% |
| Immigrants | Russia | 78.5 /100 | #146 | Good 5.1% |
| Slovaks | 77.9 /100 | #147 | Good 5.1% |
| Greeks | 77.0 /100 | #148 | Good 5.1% |
Demographics Similar to Immigrants from Zaire by Unemployment Among Seniors over 65 years
In terms of unemployment among seniors over 65 years, the demographic groups most similar to Immigrants from Zaire are Indonesian (4.5%, a difference of 0.010%), Comanche (4.6%, a difference of 0.41%), Tsimshian (4.5%, a difference of 0.50%), Immigrants from Congo (4.5%, a difference of 1.1%), and Osage (4.6%, a difference of 1.3%).
| Demographics | Rating | Rank | Unemployment Among Seniors over 65 years |
| Fijians | 100.0 /100 | #3 | Exceptional 4.2% |
| Sudanese | 100.0 /100 | #4 | Exceptional 4.4% |
| Chickasaw | 100.0 /100 | #5 | Exceptional 4.4% |
| Immigrants | Cuba | 100.0 /100 | #6 | Exceptional 4.5% |
| Immigrants | Congo | 100.0 /100 | #7 | Exceptional 4.5% |
| Tsimshian | 100.0 /100 | #8 | Exceptional 4.5% |
| Indonesians | 100.0 /100 | #9 | Exceptional 4.5% |
| Immigrants | Zaire | 100.0 /100 | #10 | Exceptional 4.5% |
| Comanche | 100.0 /100 | #11 | Exceptional 4.6% |
| Osage | 100.0 /100 | #12 | Exceptional 4.6% |
| Cubans | 100.0 /100 | #13 | Exceptional 4.6% |
| Menominee | 100.0 /100 | #14 | Exceptional 4.6% |
| Lumbee | 100.0 /100 | #15 | Exceptional 4.6% |
| Immigrants | Burma/Myanmar | 100.0 /100 | #16 | Exceptional 4.6% |
| Creek | 100.0 /100 | #17 | Exceptional 4.6% |