Cherokee vs Spaniard Unemployment Among Seniors over 65 years
COMPARE
Cherokee
Spaniard
Unemployment Among Seniors over 65 years
Unemployment Among Seniors over 65 years Comparison
Cherokee
Spaniards
5.1%
UNEMPLOYMENT AMONG SENIORS OVER 65 YEARS
81.6/ 100
METRIC RATING
141st/ 347
METRIC RANK
5.2%
UNEMPLOYMENT AMONG SENIORS OVER 65 YEARS
7.4/ 100
METRIC RATING
218th/ 347
METRIC RANK
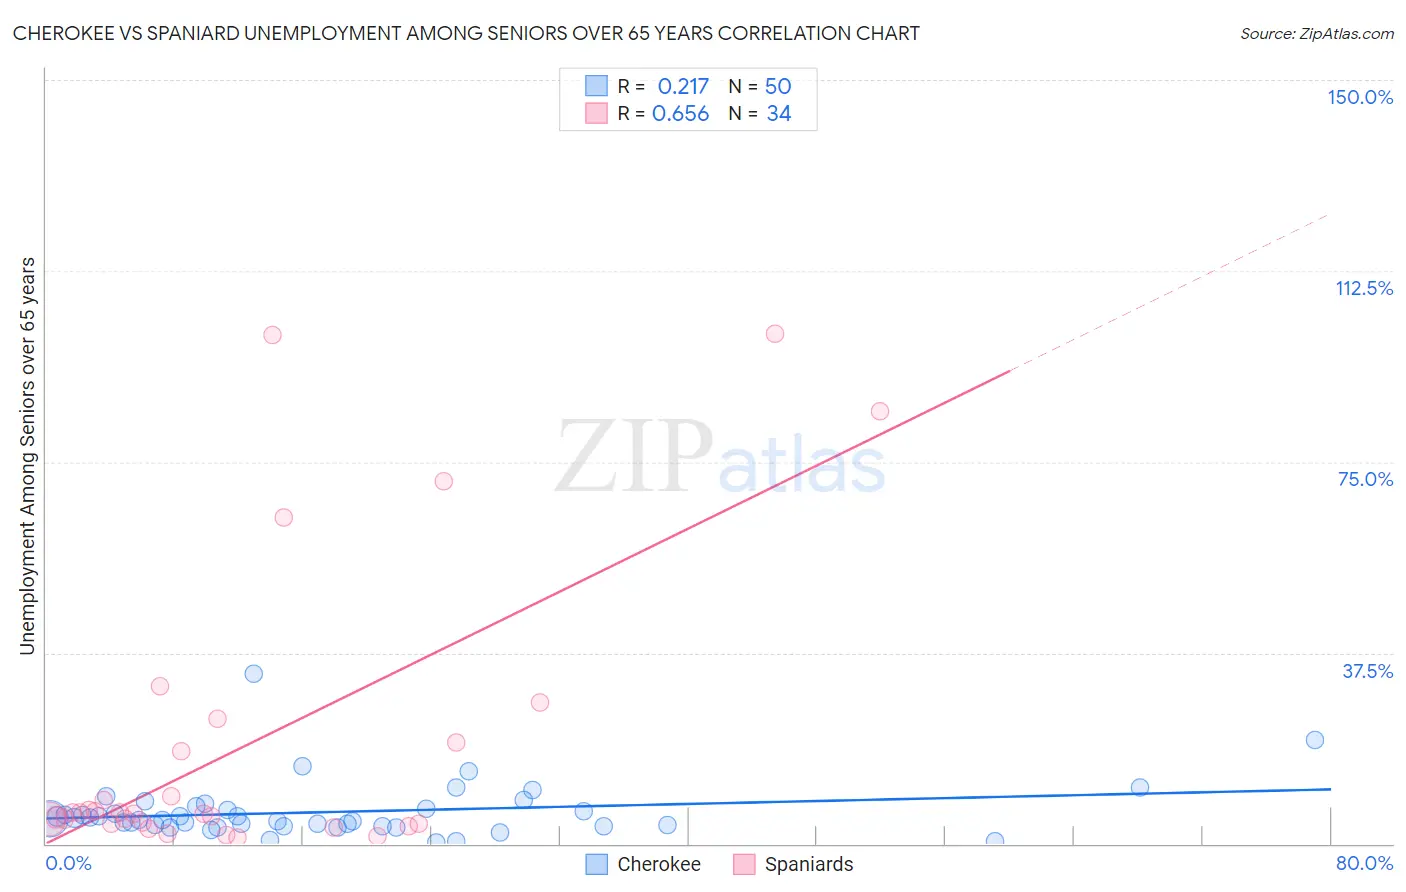
Cherokee vs Spaniard Unemployment Among Seniors over 65 years Correlation Chart
The statistical analysis conducted on geographies consisting of 416,373,281 people shows a weak positive correlation between the proportion of Cherokee and unemployment rate amomg seniors over the age of 65 in the United States with a correlation coefficient (R) of 0.217 and weighted average of 5.1%. Similarly, the statistical analysis conducted on geographies consisting of 392,679,546 people shows a significant positive correlation between the proportion of Spaniards and unemployment rate amomg seniors over the age of 65 in the United States with a correlation coefficient (R) of 0.656 and weighted average of 5.2%, a difference of 3.3%.
Unemployment Among Seniors over 65 years Correlation Summary
| Measurement | Cherokee | Spaniard |
| Minimum | 0.20% | 1.3% |
| Maximum | 33.3% | 100.2% |
| Range | 33.1% | 98.9% |
| Mean | 6.2% | 19.3% |
| Median | 4.8% | 6.0% |
| Interquartile 25% (IQ1) | 3.5% | 4.0% |
| Interquartile 75% (IQ3) | 6.8% | 19.9% |
| Interquartile Range (IQR) | 3.3% | 15.9% |
| Standard Deviation (Sample) | 5.4% | 28.9% |
| Standard Deviation (Population) | 5.4% | 28.4% |
Similar Demographics by Unemployment Among Seniors over 65 years
Demographics Similar to Cherokee by Unemployment Among Seniors over 65 years
In terms of unemployment among seniors over 65 years, the demographic groups most similar to Cherokee are Immigrants from Indonesia (5.1%, a difference of 0.030%), Senegalese (5.1%, a difference of 0.060%), Polish (5.1%, a difference of 0.070%), Immigrants from Panama (5.1%, a difference of 0.080%), and Immigrants from Chile (5.1%, a difference of 0.080%).
| Demographics | Rating | Rank | Unemployment Among Seniors over 65 years |
| Turks | 84.9 /100 | #134 | Excellent 5.1% |
| Ukrainians | 84.4 /100 | #135 | Excellent 5.1% |
| Whites/Caucasians | 84.4 /100 | #136 | Excellent 5.1% |
| Arabs | 84.3 /100 | #137 | Excellent 5.1% |
| New Zealanders | 83.2 /100 | #138 | Excellent 5.1% |
| Immigrants | Panama | 83.0 /100 | #139 | Excellent 5.1% |
| Immigrants | Chile | 83.0 /100 | #140 | Excellent 5.1% |
| Cherokee | 81.6 /100 | #141 | Excellent 5.1% |
| Immigrants | Indonesia | 81.0 /100 | #142 | Excellent 5.1% |
| Senegalese | 80.4 /100 | #143 | Excellent 5.1% |
| Poles | 80.3 /100 | #144 | Excellent 5.1% |
| Spanish | 78.8 /100 | #145 | Good 5.1% |
| Immigrants | Russia | 78.5 /100 | #146 | Good 5.1% |
| Slovaks | 77.9 /100 | #147 | Good 5.1% |
| Greeks | 77.0 /100 | #148 | Good 5.1% |
Demographics Similar to Spaniards by Unemployment Among Seniors over 65 years
In terms of unemployment among seniors over 65 years, the demographic groups most similar to Spaniards are Dutch West Indian (5.3%, a difference of 0.060%), Italian (5.2%, a difference of 0.10%), Egyptian (5.3%, a difference of 0.12%), Immigrants from Fiji (5.2%, a difference of 0.13%), and Cajun (5.2%, a difference of 0.13%).
| Demographics | Rating | Rank | Unemployment Among Seniors over 65 years |
| Africans | 10.4 /100 | #211 | Poor 5.2% |
| Immigrants | Honduras | 10.2 /100 | #212 | Poor 5.2% |
| Immigrants | Uruguay | 9.3 /100 | #213 | Tragic 5.2% |
| Albanians | 9.1 /100 | #214 | Tragic 5.2% |
| Immigrants | Fiji | 8.6 /100 | #215 | Tragic 5.2% |
| Cajuns | 8.5 /100 | #216 | Tragic 5.2% |
| Italians | 8.3 /100 | #217 | Tragic 5.2% |
| Spaniards | 7.4 /100 | #218 | Tragic 5.2% |
| Dutch West Indians | 6.9 /100 | #219 | Tragic 5.3% |
| Egyptians | 6.4 /100 | #220 | Tragic 5.3% |
| Arapaho | 6.3 /100 | #221 | Tragic 5.3% |
| Israelis | 6.2 /100 | #222 | Tragic 5.3% |
| Cree | 5.8 /100 | #223 | Tragic 5.3% |
| Immigrants | Syria | 5.6 /100 | #224 | Tragic 5.3% |
| Hondurans | 5.6 /100 | #225 | Tragic 5.3% |