Central American vs Immigrants from Nigeria Unemployment Among Women with Children Under 6 years
COMPARE
Central American
Immigrants from Nigeria
Unemployment Among Women with Children Under 6 years
Unemployment Among Women with Children Under 6 years Comparison
Central Americans
Immigrants from Nigeria
8.2%
UNEMPLOYMENT AMONG WOMEN WITH CHILDREN UNDER 6 YEARS
1.4/ 100
METRIC RATING
246th/ 347
METRIC RANK
7.9%
UNEMPLOYMENT AMONG WOMEN WITH CHILDREN UNDER 6 YEARS
10.3/ 100
METRIC RATING
217th/ 347
METRIC RANK
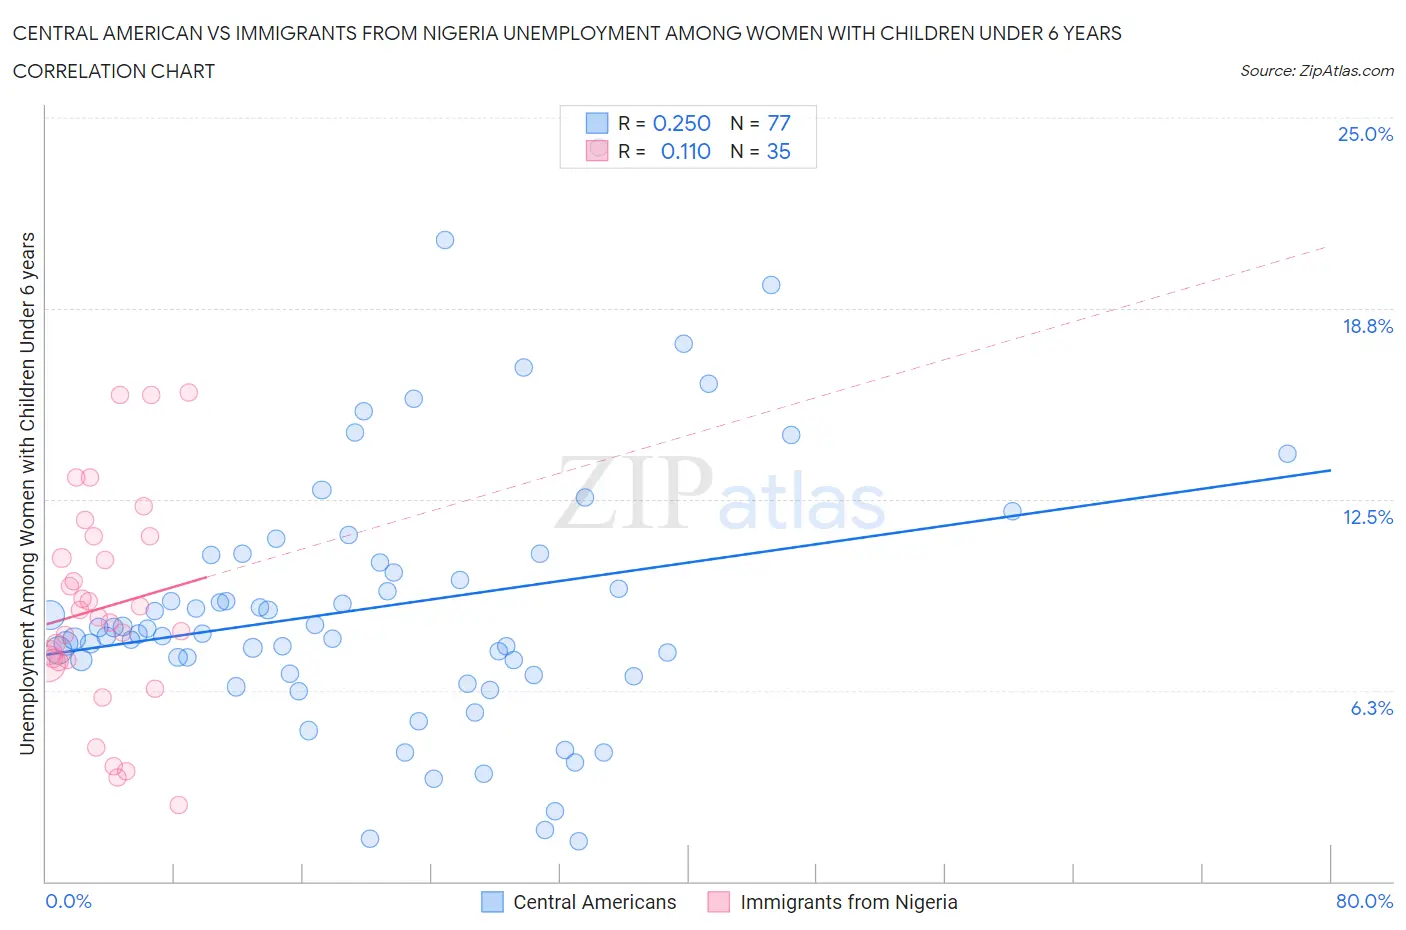
Central American vs Immigrants from Nigeria Unemployment Among Women with Children Under 6 years Correlation Chart
The statistical analysis conducted on geographies consisting of 361,380,642 people shows a weak positive correlation between the proportion of Central Americans and unemployment rate among women with children under the age of 6 in the United States with a correlation coefficient (R) of 0.250 and weighted average of 8.2%. Similarly, the statistical analysis conducted on geographies consisting of 235,747,701 people shows a poor positive correlation between the proportion of Immigrants from Nigeria and unemployment rate among women with children under the age of 6 in the United States with a correlation coefficient (R) of 0.110 and weighted average of 7.9%, a difference of 3.4%.
Unemployment Among Women with Children Under 6 years Correlation Summary
| Measurement | Central American | Immigrants from Nigeria |
| Minimum | 1.3% | 2.5% |
| Maximum | 24.0% | 16.0% |
| Range | 22.7% | 13.5% |
| Mean | 9.0% | 9.0% |
| Median | 8.1% | 8.6% |
| Interquartile 25% (IQ1) | 6.8% | 7.2% |
| Interquartile 75% (IQ3) | 10.5% | 11.3% |
| Interquartile Range (IQR) | 3.8% | 4.1% |
| Standard Deviation (Sample) | 4.3% | 3.4% |
| Standard Deviation (Population) | 4.3% | 3.4% |
Similar Demographics by Unemployment Among Women with Children Under 6 years
Demographics Similar to Central Americans by Unemployment Among Women with Children Under 6 years
In terms of unemployment among women with children under 6 years, the demographic groups most similar to Central Americans are German Russian (8.2%, a difference of 0.28%), Immigrants from Western Africa (8.2%, a difference of 0.32%), Native Hawaiian (8.2%, a difference of 0.33%), French (8.2%, a difference of 0.34%), and Hawaiian (8.2%, a difference of 0.37%).
| Demographics | Rating | Rank | Unemployment Among Women with Children Under 6 years |
| Irish | 2.7 /100 | #239 | Tragic 8.1% |
| Immigrants | El Salvador | 2.6 /100 | #240 | Tragic 8.1% |
| Liberians | 2.6 /100 | #241 | Tragic 8.1% |
| Dutch | 2.5 /100 | #242 | Tragic 8.1% |
| Hawaiians | 1.8 /100 | #243 | Tragic 8.2% |
| French | 1.7 /100 | #244 | Tragic 8.2% |
| Native Hawaiians | 1.7 /100 | #245 | Tragic 8.2% |
| Central Americans | 1.4 /100 | #246 | Tragic 8.2% |
| German Russians | 1.2 /100 | #247 | Tragic 8.2% |
| Immigrants | Western Africa | 1.1 /100 | #248 | Tragic 8.2% |
| Immigrants | Sierra Leone | 1.1 /100 | #249 | Tragic 8.2% |
| Nigerians | 1.1 /100 | #250 | Tragic 8.2% |
| Guyanese | 1.0 /100 | #251 | Tragic 8.2% |
| Ghanaians | 1.0 /100 | #252 | Tragic 8.2% |
| Immigrants | Guyana | 0.8 /100 | #253 | Tragic 8.2% |
Demographics Similar to Immigrants from Nigeria by Unemployment Among Women with Children Under 6 years
In terms of unemployment among women with children under 6 years, the demographic groups most similar to Immigrants from Nigeria are Moroccan (7.9%, a difference of 0.11%), Immigrants from Lebanon (7.9%, a difference of 0.12%), Ecuadorian (7.9%, a difference of 0.14%), Spanish (7.9%, a difference of 0.15%), and Scottish (7.9%, a difference of 0.17%).
| Demographics | Rating | Rank | Unemployment Among Women with Children Under 6 years |
| Poles | 16.0 /100 | #210 | Poor 7.9% |
| Immigrants | Ecuador | 14.9 /100 | #211 | Poor 7.9% |
| Swiss | 12.3 /100 | #212 | Poor 7.9% |
| Scottish | 11.4 /100 | #213 | Poor 7.9% |
| Spanish | 11.3 /100 | #214 | Poor 7.9% |
| Ecuadorians | 11.2 /100 | #215 | Poor 7.9% |
| Immigrants | Lebanon | 11.1 /100 | #216 | Poor 7.9% |
| Immigrants | Nigeria | 10.3 /100 | #217 | Poor 7.9% |
| Moroccans | 9.7 /100 | #218 | Tragic 7.9% |
| Arabs | 9.4 /100 | #219 | Tragic 7.9% |
| South American Indians | 9.3 /100 | #220 | Tragic 7.9% |
| Immigrants | Germany | 8.5 /100 | #221 | Tragic 7.9% |
| Samoans | 8.4 /100 | #222 | Tragic 7.9% |
| Carpatho Rusyns | 7.8 /100 | #223 | Tragic 8.0% |
| English | 7.2 /100 | #224 | Tragic 8.0% |