Immigrants from Croatia vs Immigrants from Nigeria Unemployment Among Women with Children Under 6 years
COMPARE
Immigrants from Croatia
Immigrants from Nigeria
Unemployment Among Women with Children Under 6 years
Unemployment Among Women with Children Under 6 years Comparison
Immigrants from Croatia
Immigrants from Nigeria
7.1%
UNEMPLOYMENT AMONG WOMEN WITH CHILDREN UNDER 6 YEARS
98.9/ 100
METRIC RATING
77th/ 347
METRIC RANK
7.9%
UNEMPLOYMENT AMONG WOMEN WITH CHILDREN UNDER 6 YEARS
10.3/ 100
METRIC RATING
217th/ 347
METRIC RANK
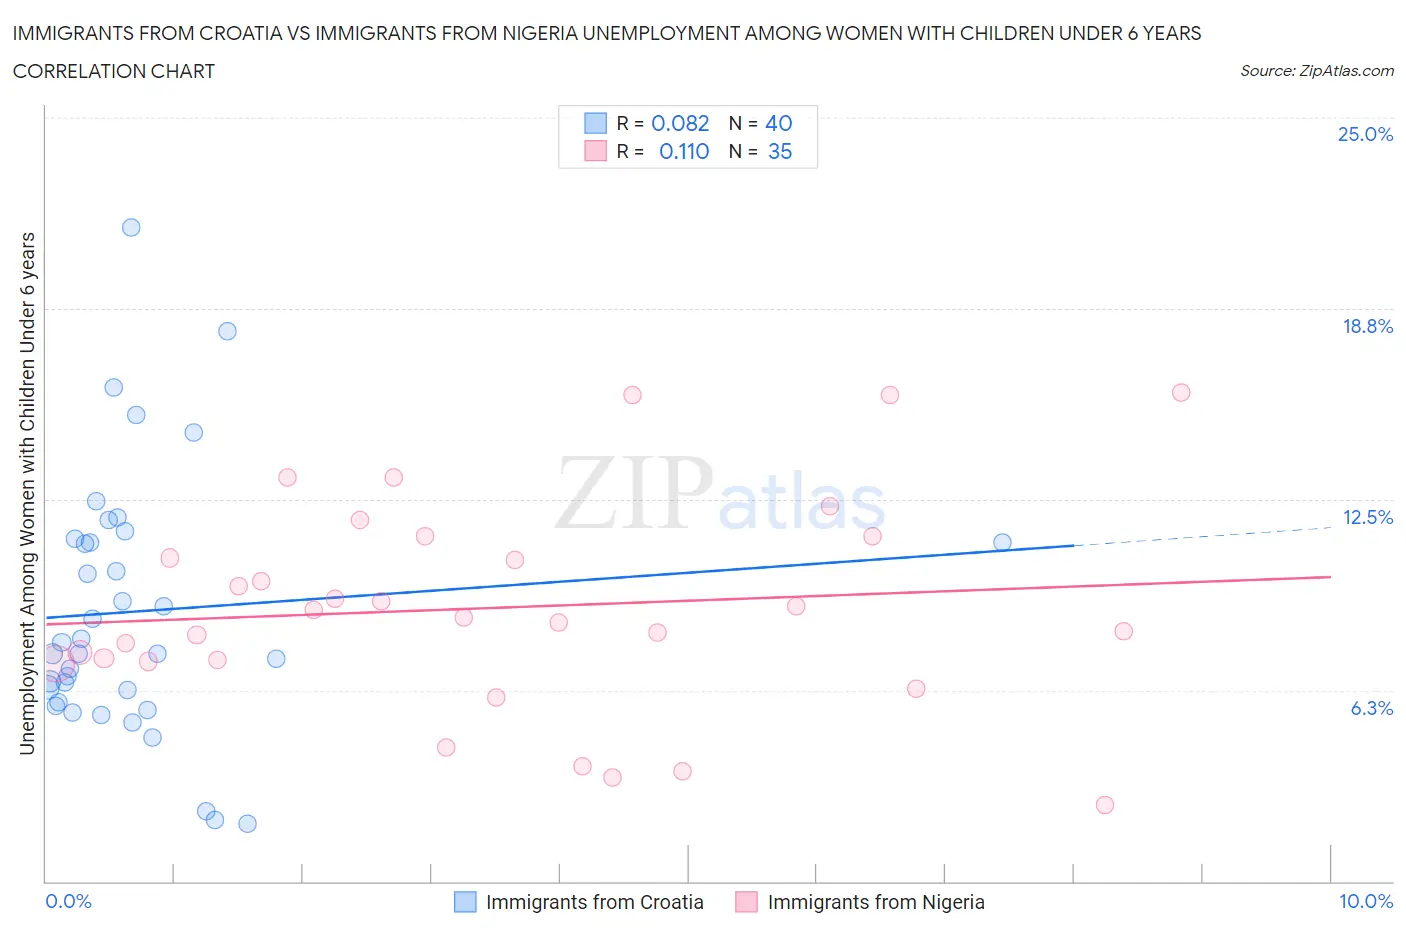
Immigrants from Croatia vs Immigrants from Nigeria Unemployment Among Women with Children Under 6 years Correlation Chart
The statistical analysis conducted on geographies consisting of 114,346,800 people shows a slight positive correlation between the proportion of Immigrants from Croatia and unemployment rate among women with children under the age of 6 in the United States with a correlation coefficient (R) of 0.082 and weighted average of 7.1%. Similarly, the statistical analysis conducted on geographies consisting of 235,747,701 people shows a poor positive correlation between the proportion of Immigrants from Nigeria and unemployment rate among women with children under the age of 6 in the United States with a correlation coefficient (R) of 0.110 and weighted average of 7.9%, a difference of 12.0%.
Unemployment Among Women with Children Under 6 years Correlation Summary
| Measurement | Immigrants from Croatia | Immigrants from Nigeria |
| Minimum | 1.9% | 2.5% |
| Maximum | 21.4% | 16.0% |
| Range | 19.5% | 13.5% |
| Mean | 8.8% | 9.0% |
| Median | 7.6% | 8.6% |
| Interquartile 25% (IQ1) | 6.1% | 7.2% |
| Interquartile 75% (IQ3) | 11.2% | 11.3% |
| Interquartile Range (IQR) | 5.1% | 4.1% |
| Standard Deviation (Sample) | 4.2% | 3.4% |
| Standard Deviation (Population) | 4.2% | 3.4% |
Similar Demographics by Unemployment Among Women with Children Under 6 years
Demographics Similar to Immigrants from Croatia by Unemployment Among Women with Children Under 6 years
In terms of unemployment among women with children under 6 years, the demographic groups most similar to Immigrants from Croatia are Estonian (7.1%, a difference of 0.030%), Immigrants from Somalia (7.1%, a difference of 0.040%), Immigrants from Eastern Europe (7.1%, a difference of 0.080%), Immigrants from Fiji (7.1%, a difference of 0.090%), and Immigrants from Greece (7.1%, a difference of 0.11%).
| Demographics | Rating | Rank | Unemployment Among Women with Children Under 6 years |
| Immigrants | Iraq | 99.4 /100 | #70 | Exceptional 7.0% |
| Afghans | 99.4 /100 | #71 | Exceptional 7.0% |
| Cubans | 99.4 /100 | #72 | Exceptional 7.0% |
| Immigrants | Czechoslovakia | 99.2 /100 | #73 | Exceptional 7.0% |
| Turks | 99.2 /100 | #74 | Exceptional 7.0% |
| Immigrants | Eastern Europe | 99.0 /100 | #75 | Exceptional 7.1% |
| Estonians | 99.0 /100 | #76 | Exceptional 7.1% |
| Immigrants | Croatia | 98.9 /100 | #77 | Exceptional 7.1% |
| Immigrants | Somalia | 98.9 /100 | #78 | Exceptional 7.1% |
| Immigrants | Fiji | 98.9 /100 | #79 | Exceptional 7.1% |
| Immigrants | Greece | 98.9 /100 | #80 | Exceptional 7.1% |
| Immigrants | Venezuela | 98.8 /100 | #81 | Exceptional 7.1% |
| Immigrants | Afghanistan | 98.7 /100 | #82 | Exceptional 7.1% |
| Egyptians | 98.7 /100 | #83 | Exceptional 7.1% |
| Immigrants | Albania | 98.7 /100 | #84 | Exceptional 7.1% |
Demographics Similar to Immigrants from Nigeria by Unemployment Among Women with Children Under 6 years
In terms of unemployment among women with children under 6 years, the demographic groups most similar to Immigrants from Nigeria are Moroccan (7.9%, a difference of 0.11%), Immigrants from Lebanon (7.9%, a difference of 0.12%), Ecuadorian (7.9%, a difference of 0.14%), Spanish (7.9%, a difference of 0.15%), and Scottish (7.9%, a difference of 0.17%).
| Demographics | Rating | Rank | Unemployment Among Women with Children Under 6 years |
| Poles | 16.0 /100 | #210 | Poor 7.9% |
| Immigrants | Ecuador | 14.9 /100 | #211 | Poor 7.9% |
| Swiss | 12.3 /100 | #212 | Poor 7.9% |
| Scottish | 11.4 /100 | #213 | Poor 7.9% |
| Spanish | 11.3 /100 | #214 | Poor 7.9% |
| Ecuadorians | 11.2 /100 | #215 | Poor 7.9% |
| Immigrants | Lebanon | 11.1 /100 | #216 | Poor 7.9% |
| Immigrants | Nigeria | 10.3 /100 | #217 | Poor 7.9% |
| Moroccans | 9.7 /100 | #218 | Tragic 7.9% |
| Arabs | 9.4 /100 | #219 | Tragic 7.9% |
| South American Indians | 9.3 /100 | #220 | Tragic 7.9% |
| Immigrants | Germany | 8.5 /100 | #221 | Tragic 7.9% |
| Samoans | 8.4 /100 | #222 | Tragic 7.9% |
| Carpatho Rusyns | 7.8 /100 | #223 | Tragic 8.0% |
| English | 7.2 /100 | #224 | Tragic 8.0% |