Central American Indian vs Barbadian Unemployment Among Ages 20 to 24 years
COMPARE
Central American Indian
Barbadian
Unemployment Among Ages 20 to 24 years
Unemployment Among Ages 20 to 24 years Comparison
Central American Indians
Barbadians
11.9%
UNEMPLOYMENT AMONG AGES 20 TO 24 YEARS
0.0/ 100
METRIC RATING
291st/ 347
METRIC RANK
12.9%
UNEMPLOYMENT AMONG AGES 20 TO 24 YEARS
0.0/ 100
METRIC RATING
318th/ 347
METRIC RANK
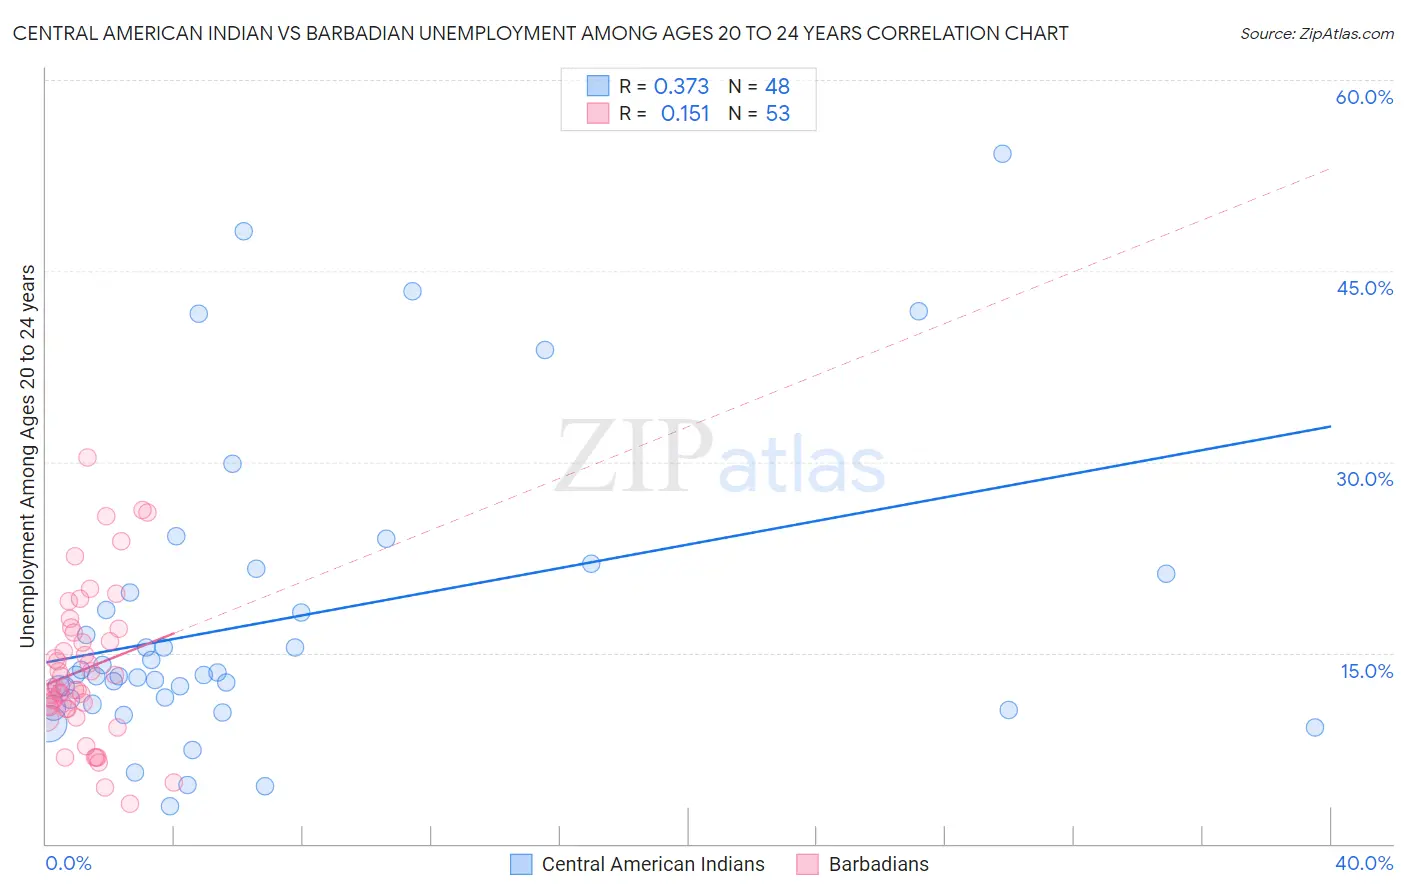
Central American Indian vs Barbadian Unemployment Among Ages 20 to 24 years Correlation Chart
The statistical analysis conducted on geographies consisting of 320,123,925 people shows a mild positive correlation between the proportion of Central American Indians and unemployment rate among population between the ages 20 and 24 in the United States with a correlation coefficient (R) of 0.373 and weighted average of 11.9%. Similarly, the statistical analysis conducted on geographies consisting of 140,027,107 people shows a poor positive correlation between the proportion of Barbadians and unemployment rate among population between the ages 20 and 24 in the United States with a correlation coefficient (R) of 0.151 and weighted average of 12.9%, a difference of 8.0%.
Unemployment Among Ages 20 to 24 years Correlation Summary
| Measurement | Central American Indian | Barbadian |
| Minimum | 2.9% | 3.1% |
| Maximum | 54.2% | 30.3% |
| Range | 51.3% | 27.2% |
| Mean | 17.6% | 13.7% |
| Median | 13.3% | 12.2% |
| Interquartile 25% (IQ1) | 11.2% | 10.6% |
| Interquartile 75% (IQ3) | 20.5% | 16.7% |
| Interquartile Range (IQR) | 9.3% | 6.1% |
| Standard Deviation (Sample) | 11.7% | 5.9% |
| Standard Deviation (Population) | 11.6% | 5.8% |
Similar Demographics by Unemployment Among Ages 20 to 24 years
Demographics Similar to Central American Indians by Unemployment Among Ages 20 to 24 years
In terms of unemployment among ages 20 to 24 years, the demographic groups most similar to Central American Indians are Immigrants from Senegal (11.9%, a difference of 0.080%), Immigrants from Ghana (11.9%, a difference of 0.31%), Immigrants from Belize (12.0%, a difference of 0.34%), Immigrants from Armenia (12.0%, a difference of 0.52%), and Cajun (12.0%, a difference of 0.55%).
| Demographics | Rating | Rank | Unemployment Among Ages 20 to 24 years |
| Immigrants | Western Africa | 0.0 /100 | #284 | Tragic 11.7% |
| Soviet Union | 0.0 /100 | #285 | Tragic 11.7% |
| Ecuadorians | 0.0 /100 | #286 | Tragic 11.8% |
| Immigrants | Ecuador | 0.0 /100 | #287 | Tragic 11.8% |
| U.S. Virgin Islanders | 0.0 /100 | #288 | Tragic 11.8% |
| Belizeans | 0.0 /100 | #289 | Tragic 11.8% |
| Immigrants | Caribbean | 0.0 /100 | #290 | Tragic 11.8% |
| Central American Indians | 0.0 /100 | #291 | Tragic 11.9% |
| Immigrants | Senegal | 0.0 /100 | #292 | Tragic 11.9% |
| Immigrants | Ghana | 0.0 /100 | #293 | Tragic 11.9% |
| Immigrants | Belize | 0.0 /100 | #294 | Tragic 12.0% |
| Immigrants | Armenia | 0.0 /100 | #295 | Tragic 12.0% |
| Cajuns | 0.0 /100 | #296 | Tragic 12.0% |
| Blackfeet | 0.0 /100 | #297 | Tragic 12.0% |
| Lumbee | 0.0 /100 | #298 | Tragic 12.0% |
Demographics Similar to Barbadians by Unemployment Among Ages 20 to 24 years
In terms of unemployment among ages 20 to 24 years, the demographic groups most similar to Barbadians are Immigrants from Trinidad and Tobago (12.8%, a difference of 0.25%), Trinidadian and Tobagonian (12.9%, a difference of 0.25%), Immigrants from Dominica (12.8%, a difference of 0.37%), Cheyenne (13.0%, a difference of 0.68%), and Immigrants from Jamaica (13.0%, a difference of 0.76%).
| Demographics | Rating | Rank | Unemployment Among Ages 20 to 24 years |
| Vietnamese | 0.0 /100 | #311 | Tragic 12.6% |
| Houma | 0.0 /100 | #312 | Tragic 12.6% |
| Shoshone | 0.0 /100 | #313 | Tragic 12.7% |
| Blacks/African Americans | 0.0 /100 | #314 | Tragic 12.7% |
| West Indians | 0.0 /100 | #315 | Tragic 12.8% |
| Immigrants | Dominica | 0.0 /100 | #316 | Tragic 12.8% |
| Immigrants | Trinidad and Tobago | 0.0 /100 | #317 | Tragic 12.8% |
| Barbadians | 0.0 /100 | #318 | Tragic 12.9% |
| Trinidadians and Tobagonians | 0.0 /100 | #319 | Tragic 12.9% |
| Cheyenne | 0.0 /100 | #320 | Tragic 13.0% |
| Immigrants | Jamaica | 0.0 /100 | #321 | Tragic 13.0% |
| Natives/Alaskans | 0.0 /100 | #322 | Tragic 13.0% |
| Yakama | 0.0 /100 | #323 | Tragic 13.1% |
| Alaska Natives | 0.0 /100 | #324 | Tragic 13.2% |
| Pueblo | 0.0 /100 | #325 | Tragic 13.2% |