Immigrants from Micronesia vs Immigrants from Indonesia Unemployment Among Ages 20 to 24 years
COMPARE
Immigrants from Micronesia
Immigrants from Indonesia
Unemployment Among Ages 20 to 24 years
Unemployment Among Ages 20 to 24 years Comparison
Immigrants from Micronesia
Immigrants from Indonesia
10.0%
UNEMPLOYMENT AMONG AGES 20 TO 24 YEARS
96.6/ 100
METRIC RATING
94th/ 347
METRIC RANK
10.1%
UNEMPLOYMENT AMONG AGES 20 TO 24 YEARS
92.7/ 100
METRIC RATING
111th/ 347
METRIC RANK
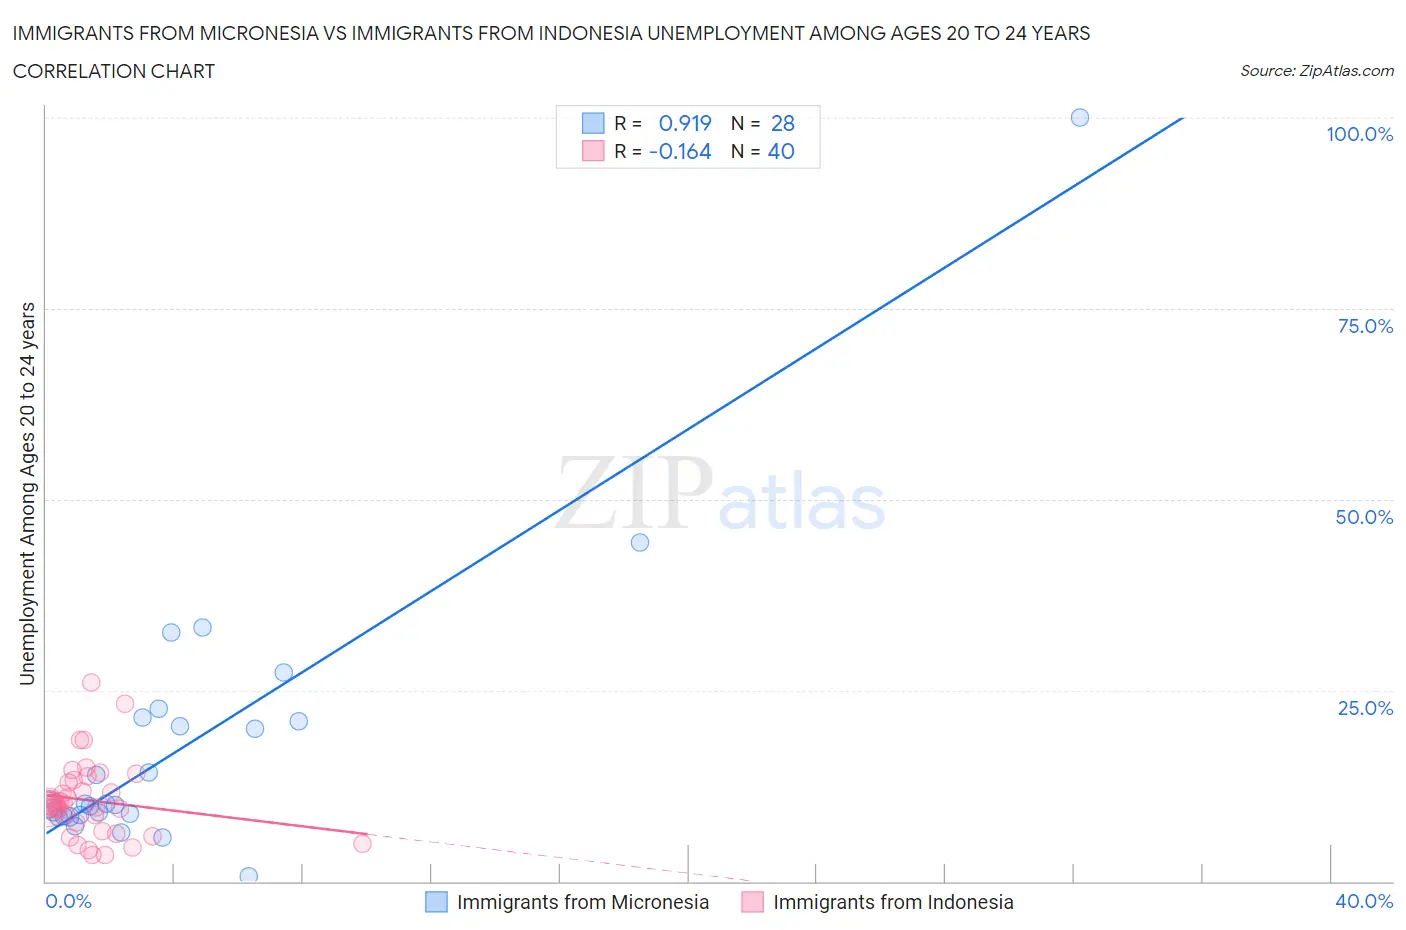
Immigrants from Micronesia vs Immigrants from Indonesia Unemployment Among Ages 20 to 24 years Correlation Chart
The statistical analysis conducted on geographies consisting of 61,256,348 people shows a near-perfect positive correlation between the proportion of Immigrants from Micronesia and unemployment rate among population between the ages 20 and 24 in the United States with a correlation coefficient (R) of 0.919 and weighted average of 10.0%. Similarly, the statistical analysis conducted on geographies consisting of 213,434,370 people shows a poor negative correlation between the proportion of Immigrants from Indonesia and unemployment rate among population between the ages 20 and 24 in the United States with a correlation coefficient (R) of -0.164 and weighted average of 10.1%, a difference of 0.76%.
Unemployment Among Ages 20 to 24 years Correlation Summary
| Measurement | Immigrants from Micronesia | Immigrants from Indonesia |
| Minimum | 0.70% | 3.4% |
| Maximum | 100.0% | 26.0% |
| Range | 99.3% | 22.6% |
| Mean | 17.9% | 10.6% |
| Median | 10.1% | 9.9% |
| Interquartile 25% (IQ1) | 8.6% | 7.1% |
| Interquartile 75% (IQ3) | 21.2% | 13.1% |
| Interquartile Range (IQR) | 12.6% | 6.0% |
| Standard Deviation (Sample) | 18.9% | 5.0% |
| Standard Deviation (Population) | 18.6% | 4.9% |
Demographics Similar to Immigrants from Micronesia and Immigrants from Indonesia by Unemployment Among Ages 20 to 24 years
In terms of unemployment among ages 20 to 24 years, the demographic groups most similar to Immigrants from Micronesia are Immigrants from Malaysia (10.0%, a difference of 0.090%), Bangladeshi (10.0%, a difference of 0.10%), Scotch-Irish (10.0%, a difference of 0.10%), Thai (10.0%, a difference of 0.10%), and Slavic (10.0%, a difference of 0.15%). Similarly, the demographic groups most similar to Immigrants from Indonesia are Northern European (10.1%, a difference of 0.010%), Immigrants from Spain (10.1%, a difference of 0.060%), Immigrants from Latvia (10.1%, a difference of 0.070%), Filipino (10.1%, a difference of 0.070%), and Iroquois (10.1%, a difference of 0.10%).
| Demographics | Rating | Rank | Unemployment Among Ages 20 to 24 years |
| Bangladeshis | 96.9 /100 | #92 | Exceptional 10.0% |
| Immigrants | Malaysia | 96.9 /100 | #93 | Exceptional 10.0% |
| Immigrants | Micronesia | 96.6 /100 | #94 | Exceptional 10.0% |
| Scotch-Irish | 96.2 /100 | #95 | Exceptional 10.0% |
| Thais | 96.2 /100 | #96 | Exceptional 10.0% |
| Slavs | 96.1 /100 | #97 | Exceptional 10.0% |
| Japanese | 95.4 /100 | #98 | Exceptional 10.0% |
| Fijians | 95.3 /100 | #99 | Exceptional 10.0% |
| Immigrants | France | 95.2 /100 | #100 | Exceptional 10.0% |
| Laotians | 95.1 /100 | #101 | Exceptional 10.0% |
| Immigrants | Argentina | 94.9 /100 | #102 | Exceptional 10.0% |
| Irish | 94.3 /100 | #103 | Exceptional 10.0% |
| Immigrants | Chile | 94.0 /100 | #104 | Exceptional 10.0% |
| Immigrants | Hungary | 94.0 /100 | #105 | Exceptional 10.0% |
| Pennsylvania Germans | 93.9 /100 | #106 | Exceptional 10.0% |
| Iroquois | 93.4 /100 | #107 | Exceptional 10.1% |
| Immigrants | Latvia | 93.2 /100 | #108 | Exceptional 10.1% |
| Filipinos | 93.2 /100 | #109 | Exceptional 10.1% |
| Immigrants | Spain | 93.1 /100 | #110 | Exceptional 10.1% |
| Immigrants | Indonesia | 92.7 /100 | #111 | Exceptional 10.1% |
| Northern Europeans | 92.7 /100 | #112 | Exceptional 10.1% |