Central American Indian vs Immigrants from Congo Disability Age 18 to 34
COMPARE
Central American Indian
Immigrants from Congo
Disability Age 18 to 34
Disability Age 18 to 34 Comparison
Central American Indians
Immigrants from Congo
6.9%
DISABILITY AGE 18 TO 34
4.7/ 100
METRIC RATING
225th/ 347
METRIC RANK
7.1%
DISABILITY AGE 18 TO 34
1.1/ 100
METRIC RATING
242nd/ 347
METRIC RANK
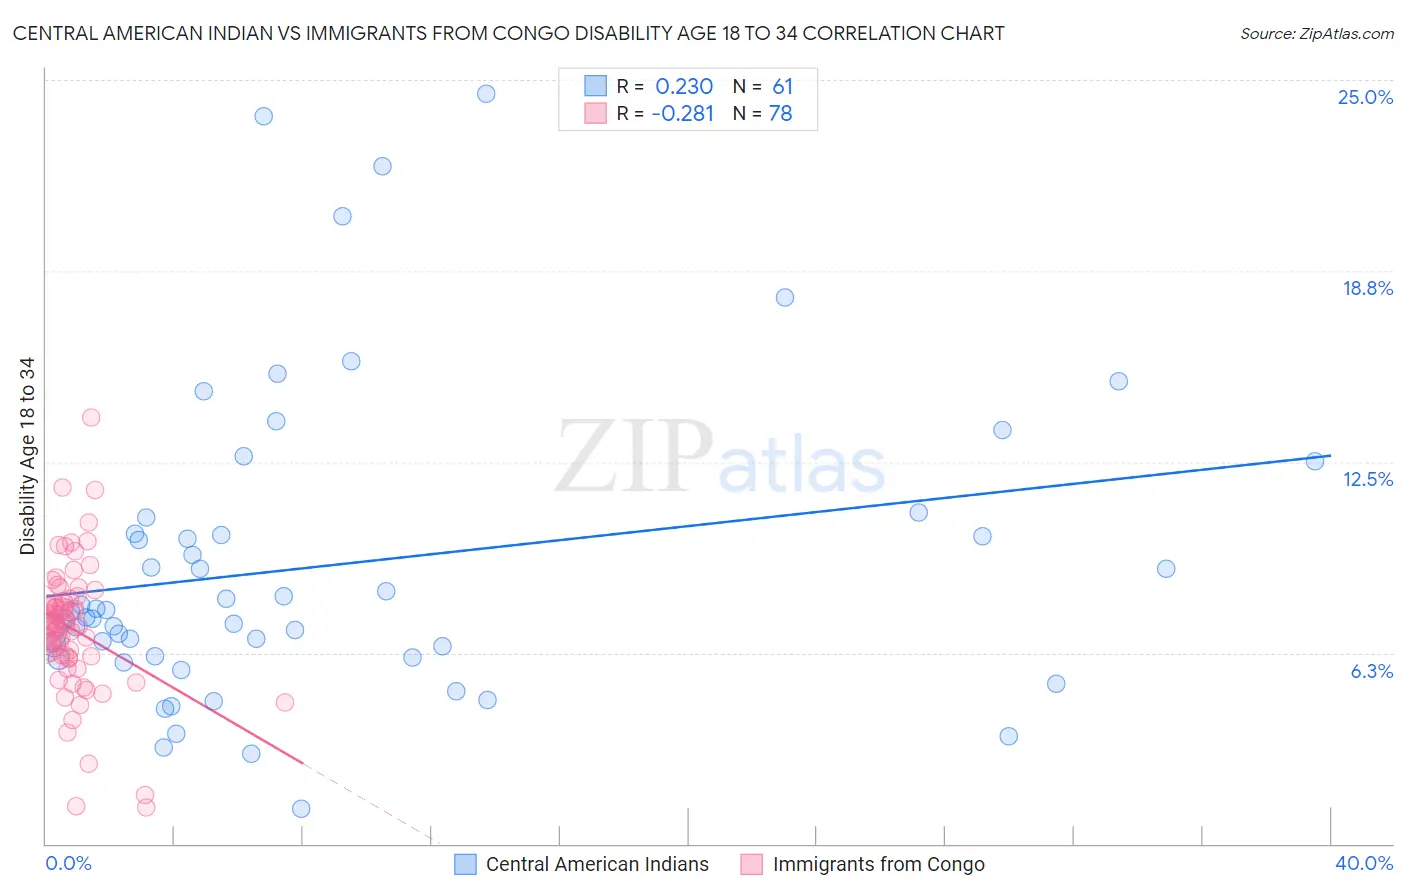
Central American Indian vs Immigrants from Congo Disability Age 18 to 34 Correlation Chart
The statistical analysis conducted on geographies consisting of 325,794,306 people shows a weak positive correlation between the proportion of Central American Indians and percentage of population with a disability between the ages 18 and 35 in the United States with a correlation coefficient (R) of 0.230 and weighted average of 6.9%. Similarly, the statistical analysis conducted on geographies consisting of 92,094,835 people shows a weak negative correlation between the proportion of Immigrants from Congo and percentage of population with a disability between the ages 18 and 35 in the United States with a correlation coefficient (R) of -0.281 and weighted average of 7.1%, a difference of 2.5%.
Disability Age 18 to 34 Correlation Summary
| Measurement | Central American Indian | Immigrants from Congo |
| Minimum | 1.1% | 1.2% |
| Maximum | 24.6% | 14.0% |
| Range | 23.4% | 12.8% |
| Mean | 9.1% | 7.0% |
| Median | 7.6% | 7.2% |
| Interquartile 25% (IQ1) | 6.1% | 6.1% |
| Interquartile 75% (IQ3) | 10.4% | 7.9% |
| Interquartile Range (IQR) | 4.3% | 1.8% |
| Standard Deviation (Sample) | 5.0% | 2.1% |
| Standard Deviation (Population) | 5.0% | 2.1% |
Demographics Similar to Central American Indians and Immigrants from Congo by Disability Age 18 to 34
In terms of disability age 18 to 34, the demographic groups most similar to Central American Indians are Senegalese (6.9%, a difference of 0.090%), Ugandan (6.9%, a difference of 0.11%), Immigrants from Canada (7.0%, a difference of 0.15%), Carpatho Rusyn (6.9%, a difference of 0.17%), and Immigrants from Yemen (7.0%, a difference of 0.21%). Similarly, the demographic groups most similar to Immigrants from Congo are Nepalese (7.1%, a difference of 0.040%), Arapaho (7.1%, a difference of 0.050%), Icelander (7.1%, a difference of 0.070%), Italian (7.1%, a difference of 0.16%), and Marshallese (7.1%, a difference of 0.28%).
| Demographics | Rating | Rank | Disability Age 18 to 34 |
| Carpatho Rusyns | 5.2 /100 | #223 | Tragic 6.9% |
| Senegalese | 4.9 /100 | #224 | Tragic 6.9% |
| Central American Indians | 4.7 /100 | #225 | Tragic 6.9% |
| Ugandans | 4.4 /100 | #226 | Tragic 6.9% |
| Immigrants | Canada | 4.3 /100 | #227 | Tragic 7.0% |
| Immigrants | Yemen | 4.2 /100 | #228 | Tragic 7.0% |
| Lithuanians | 4.1 /100 | #229 | Tragic 7.0% |
| Immigrants | North America | 3.9 /100 | #230 | Tragic 7.0% |
| Ute | 3.8 /100 | #231 | Tragic 7.0% |
| Samoans | 3.2 /100 | #232 | Tragic 7.0% |
| New Zealanders | 2.7 /100 | #233 | Tragic 7.0% |
| Alsatians | 2.1 /100 | #234 | Tragic 7.0% |
| Sub-Saharan Africans | 1.7 /100 | #235 | Tragic 7.1% |
| Liberians | 1.5 /100 | #236 | Tragic 7.1% |
| Austrians | 1.3 /100 | #237 | Tragic 7.1% |
| Marshallese | 1.3 /100 | #238 | Tragic 7.1% |
| Italians | 1.2 /100 | #239 | Tragic 7.1% |
| Arapaho | 1.1 /100 | #240 | Tragic 7.1% |
| Nepalese | 1.1 /100 | #241 | Tragic 7.1% |
| Immigrants | Congo | 1.1 /100 | #242 | Tragic 7.1% |
| Icelanders | 1.0 /100 | #243 | Tragic 7.1% |