Celtic vs Chilean In Labor Force | Age 45-54
COMPARE
Celtic
Chilean
In Labor Force | Age 45-54
In Labor Force | Age 45-54 Comparison
Celtics
Chileans
81.8%
IN LABOR FORCE | AGE 45-54
0.4/ 100
METRIC RATING
244th/ 347
METRIC RANK
83.4%
IN LABOR FORCE | AGE 45-54
97.7/ 100
METRIC RATING
67th/ 347
METRIC RANK
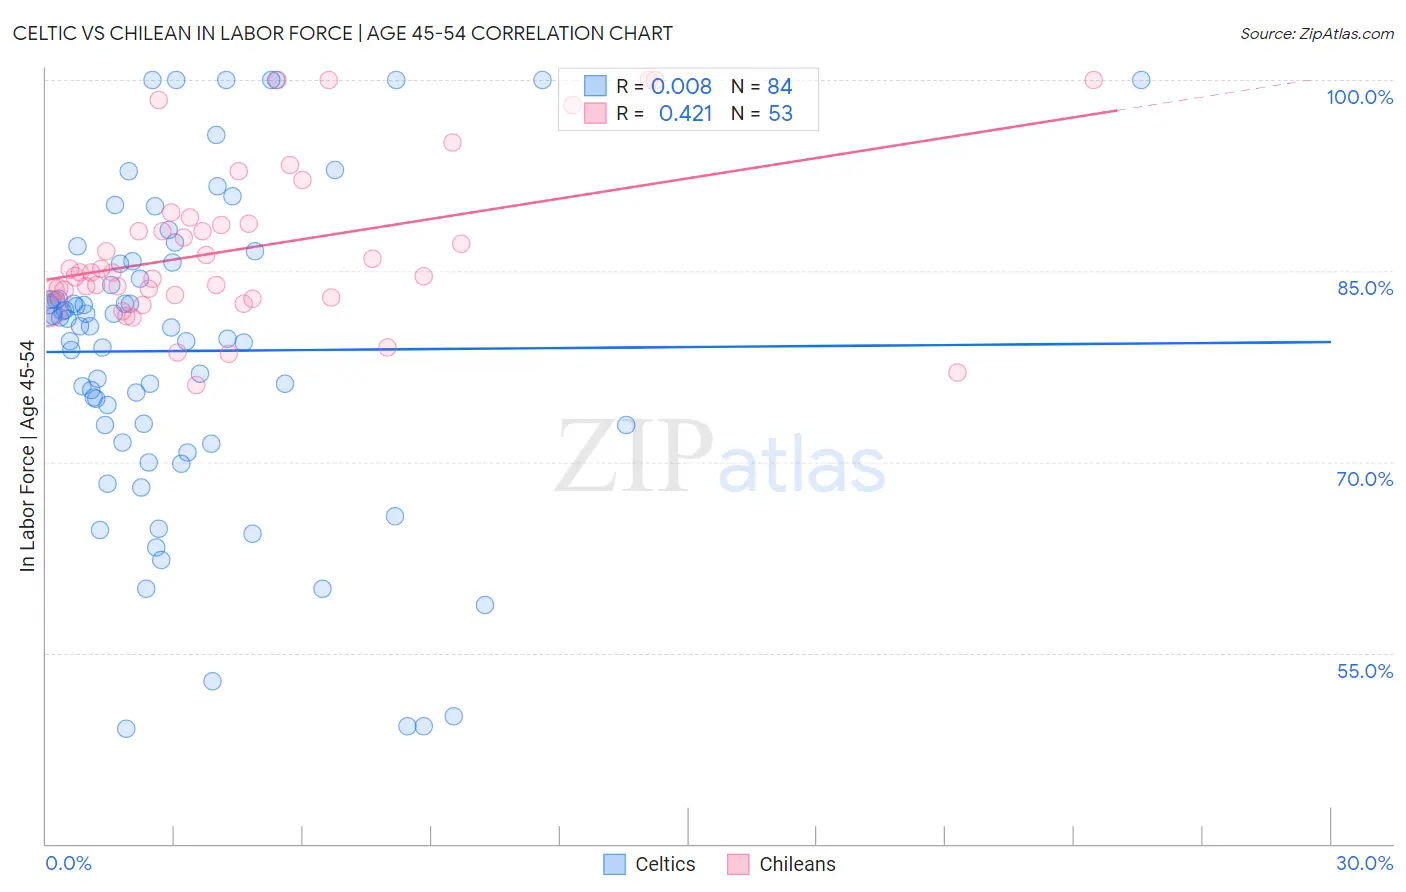
Celtic vs Chilean In Labor Force | Age 45-54 Correlation Chart
The statistical analysis conducted on geographies consisting of 168,844,950 people shows no correlation between the proportion of Celtics and labor force participation rate among population between the ages 45 and 54 in the United States with a correlation coefficient (R) of 0.008 and weighted average of 81.8%. Similarly, the statistical analysis conducted on geographies consisting of 256,549,165 people shows a moderate positive correlation between the proportion of Chileans and labor force participation rate among population between the ages 45 and 54 in the United States with a correlation coefficient (R) of 0.421 and weighted average of 83.4%, a difference of 2.1%.
In Labor Force | Age 45-54 Correlation Summary
| Measurement | Celtic | Chilean |
| Minimum | 49.0% | 76.0% |
| Maximum | 100.0% | 100.0% |
| Range | 51.0% | 24.0% |
| Mean | 78.7% | 86.8% |
| Median | 80.6% | 84.9% |
| Interquartile 25% (IQ1) | 72.2% | 83.0% |
| Interquartile 75% (IQ3) | 85.7% | 88.9% |
| Interquartile Range (IQR) | 13.5% | 5.9% |
| Standard Deviation (Sample) | 12.4% | 6.3% |
| Standard Deviation (Population) | 12.4% | 6.2% |
Similar Demographics by In Labor Force | Age 45-54
Demographics Similar to Celtics by In Labor Force | Age 45-54
In terms of in labor force | age 45-54, the demographic groups most similar to Celtics are Alaska Native (81.8%, a difference of 0.010%), Alaskan Athabascan (81.8%, a difference of 0.020%), Central American (81.7%, a difference of 0.040%), Puget Sound Salish (81.7%, a difference of 0.060%), and Hmong (81.7%, a difference of 0.080%).
| Demographics | Rating | Rank | In Labor Force | Age 45-54 |
| Immigrants | Trinidad and Tobago | 1.2 /100 | #237 | Tragic 82.0% |
| Trinidadians and Tobagonians | 1.1 /100 | #238 | Tragic 81.9% |
| Immigrants | Thailand | 1.0 /100 | #239 | Tragic 81.9% |
| Immigrants | El Salvador | 1.0 /100 | #240 | Tragic 81.9% |
| Immigrants | Cambodia | 0.8 /100 | #241 | Tragic 81.9% |
| Whites/Caucasians | 0.7 /100 | #242 | Tragic 81.9% |
| Samoans | 0.6 /100 | #243 | Tragic 81.8% |
| Celtics | 0.4 /100 | #244 | Tragic 81.8% |
| Alaska Natives | 0.4 /100 | #245 | Tragic 81.8% |
| Alaskan Athabascans | 0.4 /100 | #246 | Tragic 81.8% |
| Central Americans | 0.4 /100 | #247 | Tragic 81.7% |
| Puget Sound Salish | 0.3 /100 | #248 | Tragic 81.7% |
| Hmong | 0.3 /100 | #249 | Tragic 81.7% |
| Immigrants | Armenia | 0.2 /100 | #250 | Tragic 81.7% |
| Guamanians/Chamorros | 0.2 /100 | #251 | Tragic 81.6% |
Demographics Similar to Chileans by In Labor Force | Age 45-54
In terms of in labor force | age 45-54, the demographic groups most similar to Chileans are Asian (83.4%, a difference of 0.0%), Egyptian (83.5%, a difference of 0.010%), Immigrants from Colombia (83.4%, a difference of 0.010%), Afghan (83.5%, a difference of 0.020%), and Immigrants from Kenya (83.5%, a difference of 0.020%).
| Demographics | Rating | Rank | In Labor Force | Age 45-54 |
| Carpatho Rusyns | 98.3 /100 | #60 | Exceptional 83.5% |
| Filipinos | 98.3 /100 | #61 | Exceptional 83.5% |
| Immigrants | Taiwan | 98.0 /100 | #62 | Exceptional 83.5% |
| Afghans | 97.9 /100 | #63 | Exceptional 83.5% |
| Immigrants | Kenya | 97.9 /100 | #64 | Exceptional 83.5% |
| Egyptians | 97.9 /100 | #65 | Exceptional 83.5% |
| Asians | 97.7 /100 | #66 | Exceptional 83.4% |
| Chileans | 97.7 /100 | #67 | Exceptional 83.4% |
| Immigrants | Colombia | 97.6 /100 | #68 | Exceptional 83.4% |
| Taiwanese | 97.5 /100 | #69 | Exceptional 83.4% |
| Immigrants | Latvia | 97.4 /100 | #70 | Exceptional 83.4% |
| Colombians | 97.3 /100 | #71 | Exceptional 83.4% |
| Serbians | 97.2 /100 | #72 | Exceptional 83.4% |
| Immigrants | Czechoslovakia | 97.1 /100 | #73 | Exceptional 83.4% |
| Immigrants | Somalia | 96.9 /100 | #74 | Exceptional 83.4% |