Carpatho Rusyn vs Okinawan Unemployment Among Ages 65 to 74 years
COMPARE
Carpatho Rusyn
Okinawan
Unemployment Among Ages 65 to 74 years
Unemployment Among Ages 65 to 74 years Comparison
Carpatho Rusyns
Okinawans
5.1%
UNEMPLOYMENT AMONG AGES 65 TO 74 YEARS
99.6/ 100
METRIC RATING
55th/ 347
METRIC RANK
5.2%
UNEMPLOYMENT AMONG AGES 65 TO 74 YEARS
99.0/ 100
METRIC RATING
75th/ 347
METRIC RANK
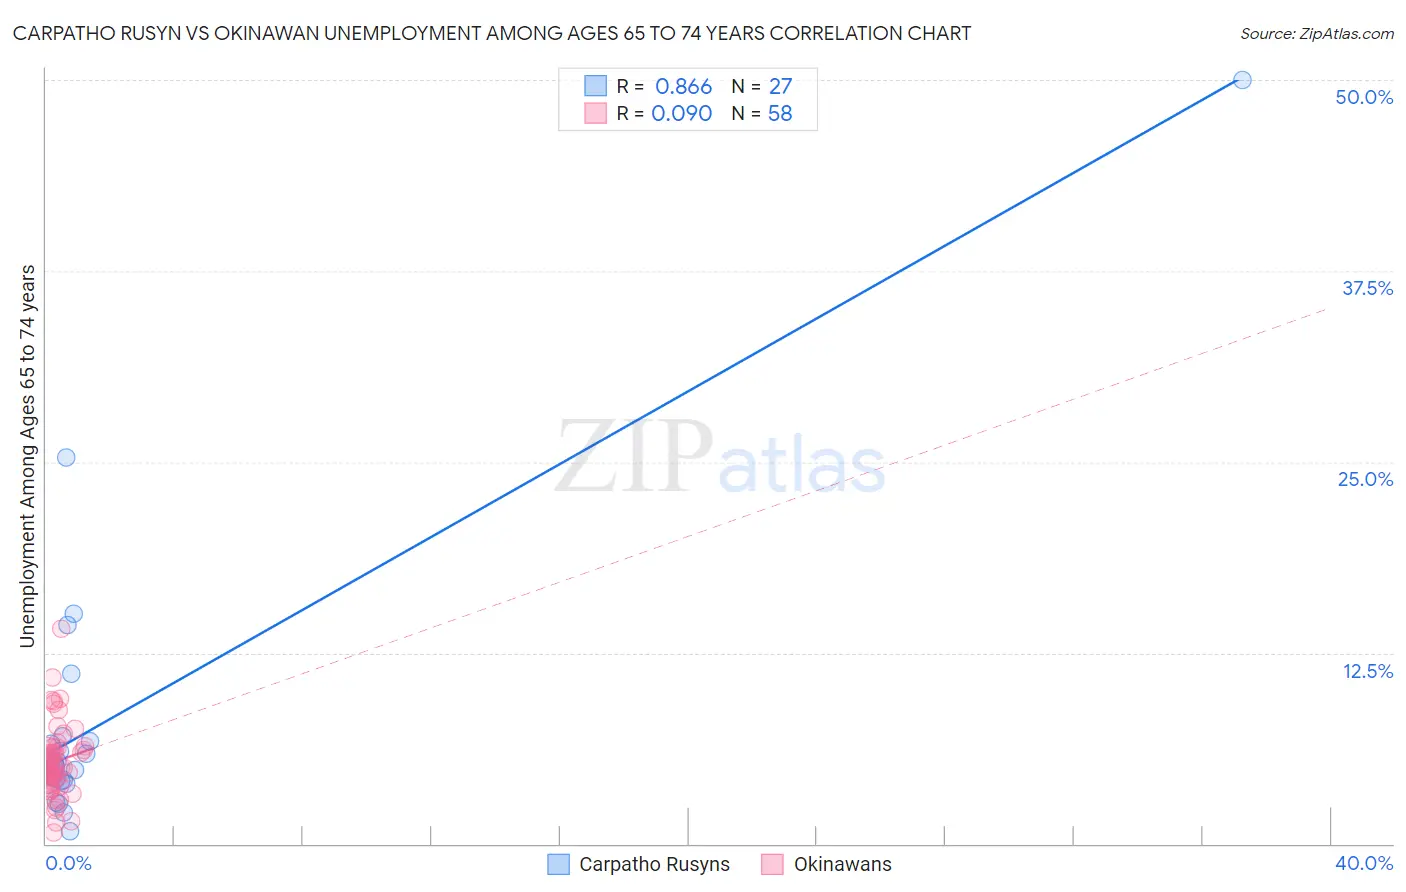
Carpatho Rusyn vs Okinawan Unemployment Among Ages 65 to 74 years Correlation Chart
The statistical analysis conducted on geographies consisting of 56,803,186 people shows a very strong positive correlation between the proportion of Carpatho Rusyns and unemployment rate among population between the ages 65 and 74 in the United States with a correlation coefficient (R) of 0.866 and weighted average of 5.1%. Similarly, the statistical analysis conducted on geographies consisting of 71,850,554 people shows a slight positive correlation between the proportion of Okinawans and unemployment rate among population between the ages 65 and 74 in the United States with a correlation coefficient (R) of 0.090 and weighted average of 5.2%, a difference of 0.74%.
Unemployment Among Ages 65 to 74 years Correlation Summary
| Measurement | Carpatho Rusyn | Okinawan |
| Minimum | 0.80% | 0.70% |
| Maximum | 50.0% | 14.1% |
| Range | 49.2% | 13.4% |
| Mean | 8.0% | 5.4% |
| Median | 5.0% | 5.0% |
| Interquartile 25% (IQ1) | 4.1% | 4.0% |
| Interquartile 75% (IQ3) | 6.7% | 6.3% |
| Interquartile Range (IQR) | 2.6% | 2.3% |
| Standard Deviation (Sample) | 9.8% | 2.4% |
| Standard Deviation (Population) | 9.6% | 2.3% |
Demographics Similar to Carpatho Rusyns and Okinawans by Unemployment Among Ages 65 to 74 years
In terms of unemployment among ages 65 to 74 years, the demographic groups most similar to Carpatho Rusyns are Swedish (5.1%, a difference of 0.080%), Croatian (5.1%, a difference of 0.080%), German (5.1%, a difference of 0.13%), Immigrants from Bulgaria (5.1%, a difference of 0.18%), and Immigrants from Jordan (5.1%, a difference of 0.23%). Similarly, the demographic groups most similar to Okinawans are Filipino (5.2%, a difference of 0.010%), Afghan (5.2%, a difference of 0.010%), Immigrants from Oceania (5.2%, a difference of 0.040%), Scotch-Irish (5.2%, a difference of 0.050%), and Immigrants from Japan (5.2%, a difference of 0.16%).
| Demographics | Rating | Rank | Unemployment Among Ages 65 to 74 years |
| Carpatho Rusyns | 99.6 /100 | #55 | Exceptional 5.1% |
| Swedes | 99.5 /100 | #56 | Exceptional 5.1% |
| Croatians | 99.5 /100 | #57 | Exceptional 5.1% |
| Germans | 99.5 /100 | #58 | Exceptional 5.1% |
| Immigrants | Bulgaria | 99.4 /100 | #59 | Exceptional 5.1% |
| Immigrants | Jordan | 99.4 /100 | #60 | Exceptional 5.1% |
| Immigrants | Taiwan | 99.4 /100 | #61 | Exceptional 5.1% |
| Nicaraguans | 99.4 /100 | #62 | Exceptional 5.1% |
| Kiowa | 99.3 /100 | #63 | Exceptional 5.1% |
| Immigrants | Moldova | 99.3 /100 | #64 | Exceptional 5.1% |
| Bolivians | 99.3 /100 | #65 | Exceptional 5.1% |
| Iroquois | 99.3 /100 | #66 | Exceptional 5.1% |
| Swiss | 99.2 /100 | #67 | Exceptional 5.1% |
| Latvians | 99.2 /100 | #68 | Exceptional 5.1% |
| Scandinavians | 99.1 /100 | #69 | Exceptional 5.2% |
| Immigrants | Japan | 99.1 /100 | #70 | Exceptional 5.2% |
| Scotch-Irish | 99.0 /100 | #71 | Exceptional 5.2% |
| Immigrants | Oceania | 99.0 /100 | #72 | Exceptional 5.2% |
| Filipinos | 99.0 /100 | #73 | Exceptional 5.2% |
| Afghans | 99.0 /100 | #74 | Exceptional 5.2% |
| Okinawans | 99.0 /100 | #75 | Exceptional 5.2% |