Cape Verdean vs Haitian Unemployment Among Ages 30 to 34 years
COMPARE
Cape Verdean
Haitian
Unemployment Among Ages 30 to 34 years
Unemployment Among Ages 30 to 34 years Comparison
Cape Verdeans
Haitians
7.2%
UNEMPLOYMENT AMONG AGES 30 TO 34 YEARS
0.0/ 100
METRIC RATING
320th/ 347
METRIC RANK
6.1%
UNEMPLOYMENT AMONG AGES 30 TO 34 YEARS
0.1/ 100
METRIC RATING
259th/ 347
METRIC RANK
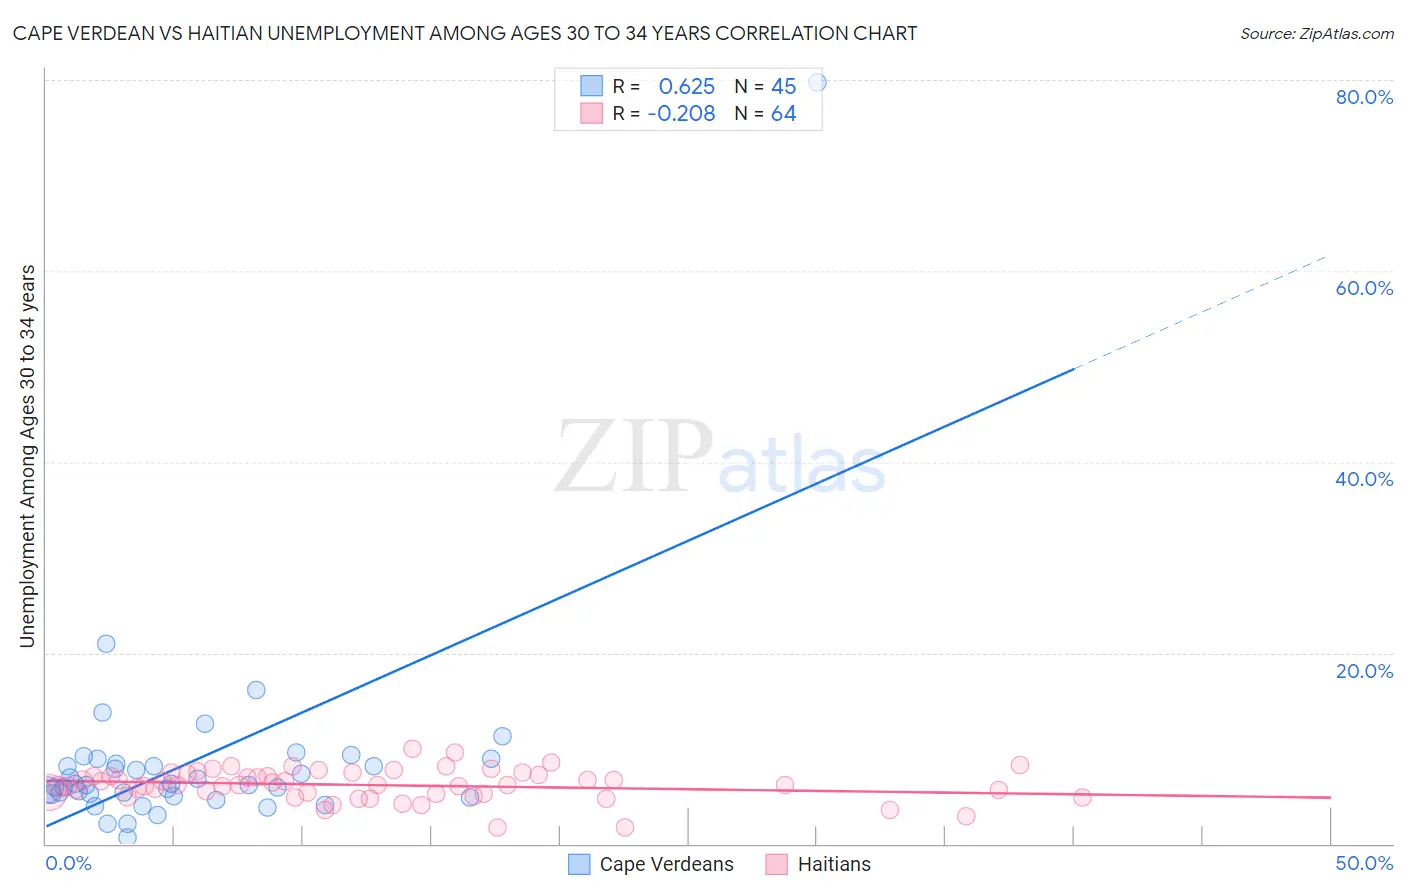
Cape Verdean vs Haitian Unemployment Among Ages 30 to 34 years Correlation Chart
The statistical analysis conducted on geographies consisting of 105,621,917 people shows a significant positive correlation between the proportion of Cape Verdeans and unemployment rate among population between the ages 30 and 34 in the United States with a correlation coefficient (R) of 0.625 and weighted average of 7.2%. Similarly, the statistical analysis conducted on geographies consisting of 276,594,642 people shows a weak negative correlation between the proportion of Haitians and unemployment rate among population between the ages 30 and 34 in the United States with a correlation coefficient (R) of -0.208 and weighted average of 6.1%, a difference of 17.2%.
Unemployment Among Ages 30 to 34 years Correlation Summary
| Measurement | Cape Verdean | Haitian |
| Minimum | 0.60% | 1.7% |
| Maximum | 79.7% | 10.0% |
| Range | 79.1% | 8.3% |
| Mean | 8.6% | 6.2% |
| Median | 6.2% | 6.2% |
| Interquartile 25% (IQ1) | 5.1% | 5.2% |
| Interquartile 75% (IQ3) | 8.7% | 7.3% |
| Interquartile Range (IQR) | 3.6% | 2.0% |
| Standard Deviation (Sample) | 11.4% | 1.6% |
| Standard Deviation (Population) | 11.3% | 1.6% |
Similar Demographics by Unemployment Among Ages 30 to 34 years
Demographics Similar to Cape Verdeans by Unemployment Among Ages 30 to 34 years
In terms of unemployment among ages 30 to 34 years, the demographic groups most similar to Cape Verdeans are Guyanese (7.2%, a difference of 0.020%), Black/African American (7.2%, a difference of 0.090%), Immigrants from Cabo Verde (7.2%, a difference of 0.19%), Immigrants from Guyana (7.2%, a difference of 0.29%), and Houma (7.2%, a difference of 0.46%).
| Demographics | Rating | Rank | Unemployment Among Ages 30 to 34 years |
| Ute | 0.0 /100 | #313 | Tragic 7.0% |
| Lumbee | 0.0 /100 | #314 | Tragic 7.1% |
| Aleuts | 0.0 /100 | #315 | Tragic 7.1% |
| Houma | 0.0 /100 | #316 | Tragic 7.2% |
| Immigrants | Cabo Verde | 0.0 /100 | #317 | Tragic 7.2% |
| Blacks/African Americans | 0.0 /100 | #318 | Tragic 7.2% |
| Guyanese | 0.0 /100 | #319 | Tragic 7.2% |
| Cape Verdeans | 0.0 /100 | #320 | Tragic 7.2% |
| Immigrants | Guyana | 0.0 /100 | #321 | Tragic 7.2% |
| Marshallese | 0.0 /100 | #322 | Tragic 7.2% |
| Immigrants | Yemen | 0.0 /100 | #323 | Tragic 7.3% |
| Immigrants | Dominica | 0.0 /100 | #324 | Tragic 7.3% |
| Apache | 0.0 /100 | #325 | Tragic 7.3% |
| Dominicans | 0.0 /100 | #326 | Tragic 7.7% |
| Immigrants | Dominican Republic | 0.0 /100 | #327 | Tragic 7.7% |
Demographics Similar to Haitians by Unemployment Among Ages 30 to 34 years
In terms of unemployment among ages 30 to 34 years, the demographic groups most similar to Haitians are Mexican (6.1%, a difference of 0.080%), Immigrants from Sierra Leone (6.1%, a difference of 0.15%), Immigrants from Ghana (6.1%, a difference of 0.18%), Immigrants from Latin America (6.1%, a difference of 0.22%), and Immigrants from Western Africa (6.2%, a difference of 0.36%).
| Demographics | Rating | Rank | Unemployment Among Ages 30 to 34 years |
| Potawatomi | 0.2 /100 | #252 | Tragic 6.0% |
| Immigrants | Nonimmigrants | 0.2 /100 | #253 | Tragic 6.1% |
| Armenians | 0.1 /100 | #254 | Tragic 6.1% |
| Immigrants | Portugal | 0.1 /100 | #255 | Tragic 6.1% |
| Immigrants | Ghana | 0.1 /100 | #256 | Tragic 6.1% |
| Immigrants | Sierra Leone | 0.1 /100 | #257 | Tragic 6.1% |
| Mexicans | 0.1 /100 | #258 | Tragic 6.1% |
| Haitians | 0.1 /100 | #259 | Tragic 6.1% |
| Immigrants | Latin America | 0.1 /100 | #260 | Tragic 6.1% |
| Immigrants | Western Africa | 0.1 /100 | #261 | Tragic 6.2% |
| Immigrants | Central America | 0.1 /100 | #262 | Tragic 6.2% |
| Spanish Americans | 0.0 /100 | #263 | Tragic 6.2% |
| Chickasaw | 0.0 /100 | #264 | Tragic 6.2% |
| Americans | 0.0 /100 | #265 | Tragic 6.2% |
| Seminole | 0.0 /100 | #266 | Tragic 6.2% |