Cambodian vs Immigrants from Ireland Unemployment Among Women with Children Under 6 years
COMPARE
Cambodian
Immigrants from Ireland
Unemployment Among Women with Children Under 6 years
Unemployment Among Women with Children Under 6 years Comparison
Cambodians
Immigrants from Ireland
5.9%
UNEMPLOYMENT AMONG WOMEN WITH CHILDREN UNDER 6 YEARS
100.0/ 100
METRIC RATING
4th/ 347
METRIC RANK
6.8%
UNEMPLOYMENT AMONG WOMEN WITH CHILDREN UNDER 6 YEARS
99.9/ 100
METRIC RATING
50th/ 347
METRIC RANK
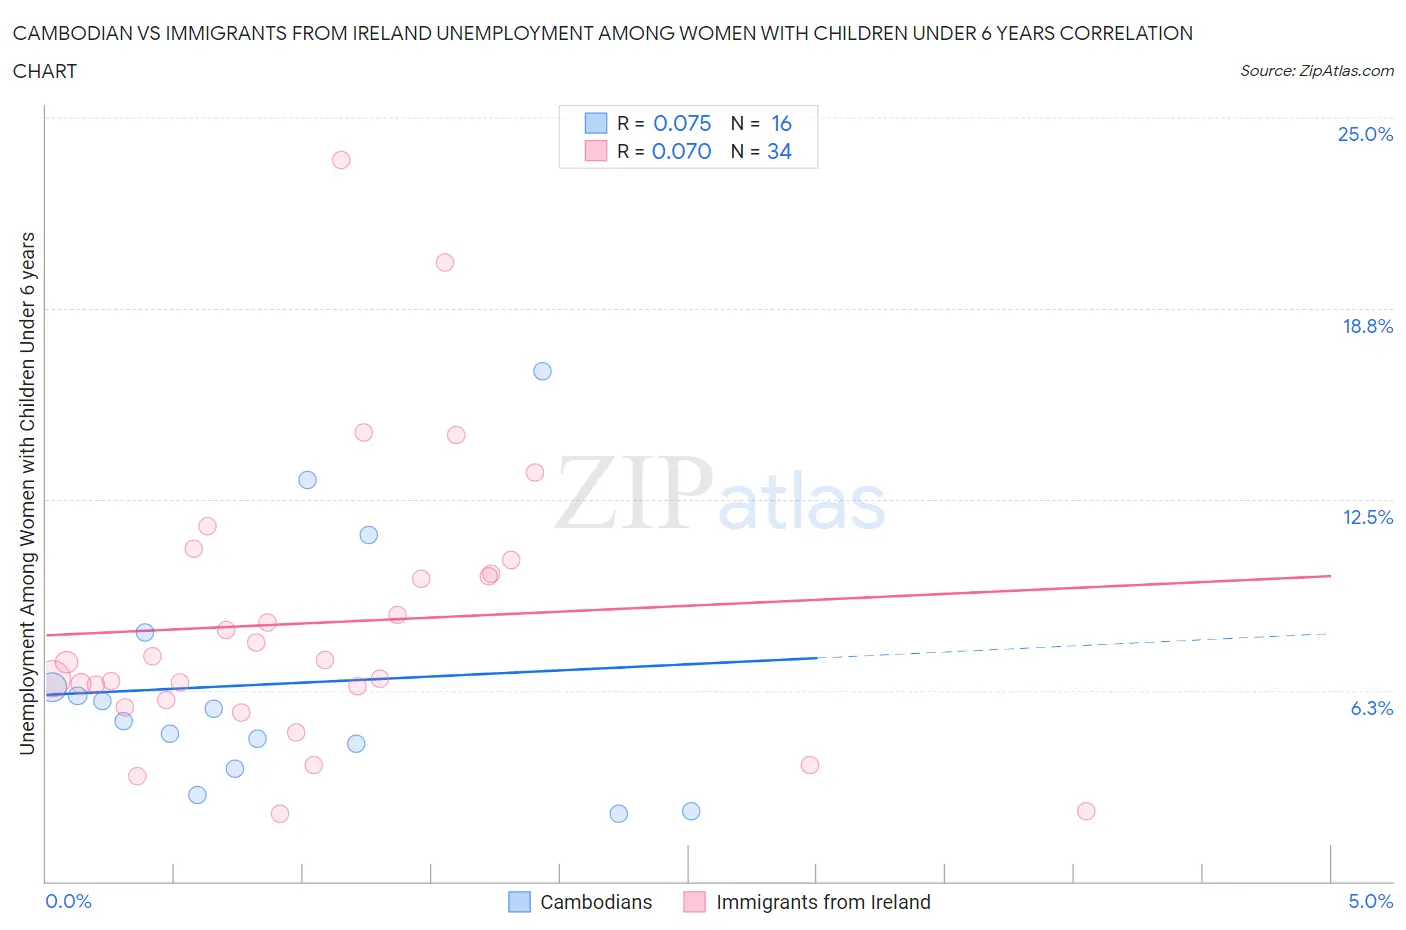
Cambodian vs Immigrants from Ireland Unemployment Among Women with Children Under 6 years Correlation Chart
The statistical analysis conducted on geographies consisting of 91,894,760 people shows a slight positive correlation between the proportion of Cambodians and unemployment rate among women with children under the age of 6 in the United States with a correlation coefficient (R) of 0.075 and weighted average of 5.9%. Similarly, the statistical analysis conducted on geographies consisting of 193,495,691 people shows a slight positive correlation between the proportion of Immigrants from Ireland and unemployment rate among women with children under the age of 6 in the United States with a correlation coefficient (R) of 0.070 and weighted average of 6.8%, a difference of 15.2%.
Unemployment Among Women with Children Under 6 years Correlation Summary
| Measurement | Cambodian | Immigrants from Ireland |
| Minimum | 2.2% | 2.2% |
| Maximum | 16.7% | 23.6% |
| Range | 14.5% | 21.4% |
| Mean | 6.5% | 8.5% |
| Median | 5.4% | 7.2% |
| Interquartile 25% (IQ1) | 4.1% | 5.9% |
| Interquartile 75% (IQ3) | 7.2% | 10.1% |
| Interquartile Range (IQR) | 3.1% | 4.2% |
| Standard Deviation (Sample) | 4.0% | 4.6% |
| Standard Deviation (Population) | 3.9% | 4.6% |
Similar Demographics by Unemployment Among Women with Children Under 6 years
Demographics Similar to Cambodians by Unemployment Among Women with Children Under 6 years
In terms of unemployment among women with children under 6 years, the demographic groups most similar to Cambodians are Okinawan (5.8%, a difference of 0.88%), Cape Verdean (5.9%, a difference of 1.0%), Immigrants from Hong Kong (5.8%, a difference of 1.8%), Immigrants from Taiwan (6.0%, a difference of 2.7%), and Taiwanese (6.1%, a difference of 3.3%).
| Demographics | Rating | Rank | Unemployment Among Women with Children Under 6 years |
| Immigrants | Cabo Verde | 100.0 /100 | #1 | Exceptional 5.4% |
| Immigrants | Hong Kong | 100.0 /100 | #2 | Exceptional 5.8% |
| Okinawans | 100.0 /100 | #3 | Exceptional 5.8% |
| Cambodians | 100.0 /100 | #4 | Exceptional 5.9% |
| Cape Verdeans | 100.0 /100 | #5 | Exceptional 5.9% |
| Immigrants | Taiwan | 100.0 /100 | #6 | Exceptional 6.0% |
| Taiwanese | 100.0 /100 | #7 | Exceptional 6.1% |
| Immigrants | India | 100.0 /100 | #8 | Exceptional 6.1% |
| Filipinos | 100.0 /100 | #9 | Exceptional 6.1% |
| Immigrants | China | 100.0 /100 | #10 | Exceptional 6.2% |
| Indians (Asian) | 100.0 /100 | #11 | Exceptional 6.3% |
| Immigrants | Singapore | 100.0 /100 | #12 | Exceptional 6.3% |
| Immigrants | Eastern Asia | 100.0 /100 | #13 | Exceptional 6.3% |
| Immigrants | Bulgaria | 100.0 /100 | #14 | Exceptional 6.3% |
| Thais | 100.0 /100 | #15 | Exceptional 6.3% |
Demographics Similar to Immigrants from Ireland by Unemployment Among Women with Children Under 6 years
In terms of unemployment among women with children under 6 years, the demographic groups most similar to Immigrants from Ireland are Immigrants from Nepal (6.8%, a difference of 0.010%), Ethiopian (6.8%, a difference of 0.020%), Immigrants from Switzerland (6.8%, a difference of 0.060%), Immigrants from Asia (6.8%, a difference of 0.090%), and Immigrants from Iran (6.8%, a difference of 0.13%).
| Demographics | Rating | Rank | Unemployment Among Women with Children Under 6 years |
| Bhutanese | 99.9 /100 | #43 | Exceptional 6.7% |
| Iranians | 99.9 /100 | #44 | Exceptional 6.7% |
| Immigrants | Australia | 99.9 /100 | #45 | Exceptional 6.8% |
| Latvians | 99.9 /100 | #46 | Exceptional 6.8% |
| Immigrants | Asia | 99.9 /100 | #47 | Exceptional 6.8% |
| Immigrants | Switzerland | 99.9 /100 | #48 | Exceptional 6.8% |
| Immigrants | Nepal | 99.9 /100 | #49 | Exceptional 6.8% |
| Immigrants | Ireland | 99.9 /100 | #50 | Exceptional 6.8% |
| Ethiopians | 99.9 /100 | #51 | Exceptional 6.8% |
| Immigrants | Iran | 99.9 /100 | #52 | Exceptional 6.8% |
| Chinese | 99.9 /100 | #53 | Exceptional 6.8% |
| Immigrants | Latvia | 99.9 /100 | #54 | Exceptional 6.8% |
| Immigrants | Ukraine | 99.8 /100 | #55 | Exceptional 6.8% |
| Immigrants | Ethiopia | 99.8 /100 | #56 | Exceptional 6.9% |
| Icelanders | 99.8 /100 | #57 | Exceptional 6.9% |