Cambodian vs Immigrants from Western Africa Unemployment Among Seniors over 75 years
COMPARE
Cambodian
Immigrants from Western Africa
Unemployment Among Seniors over 75 years
Unemployment Among Seniors over 75 years Comparison
Cambodians
Immigrants from Western Africa
7.6%
UNEMPLOYMENT AMONG SENIORS OVER 75 YEARS
100.0/ 100
METRIC RATING
33rd/ 347
METRIC RANK
9.8%
UNEMPLOYMENT AMONG SENIORS OVER 75 YEARS
0.0/ 100
METRIC RATING
292nd/ 347
METRIC RANK
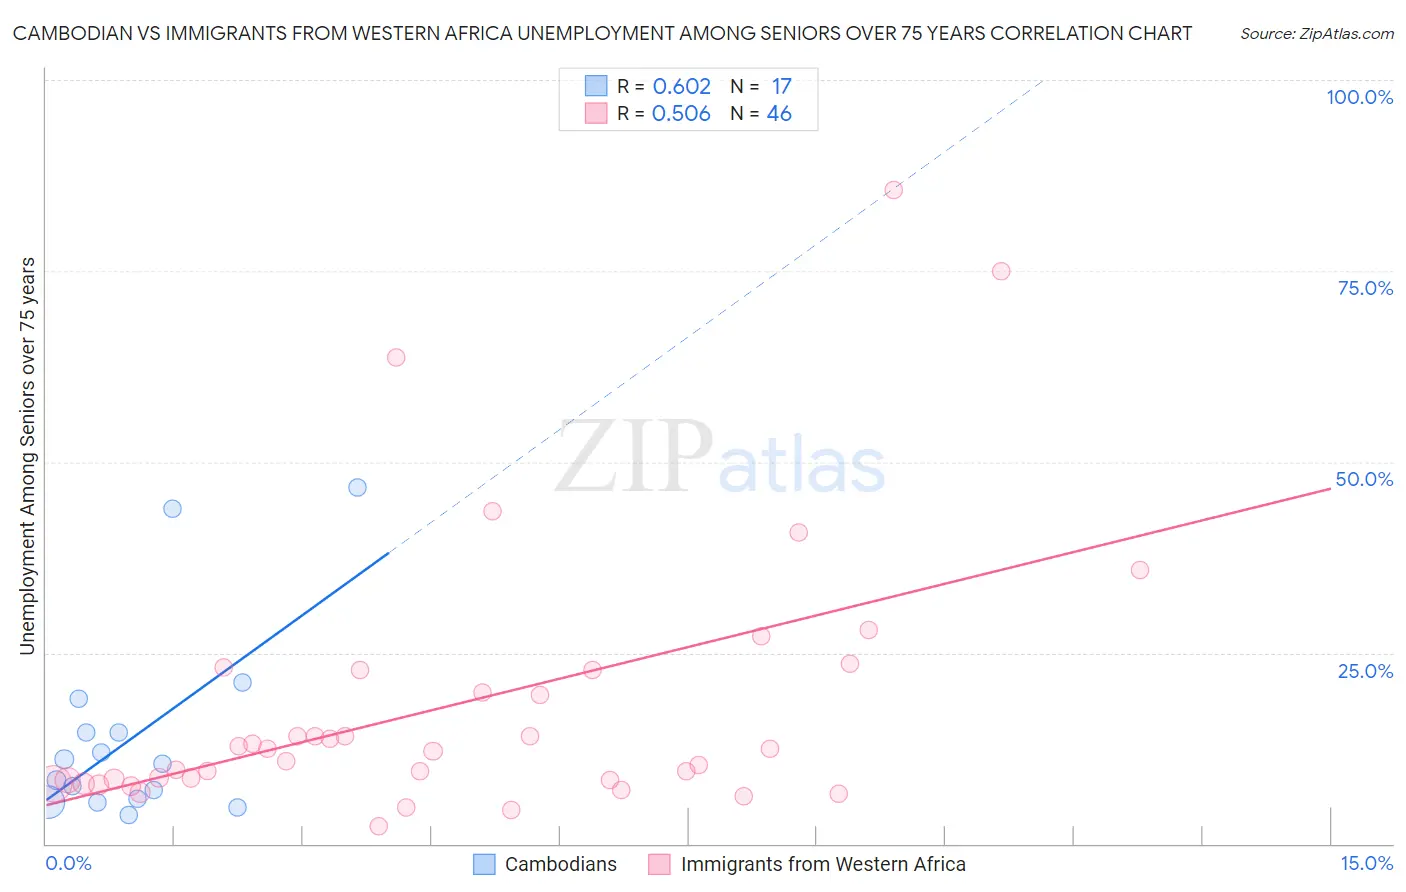
Cambodian vs Immigrants from Western Africa Unemployment Among Seniors over 75 years Correlation Chart
The statistical analysis conducted on geographies consisting of 78,067,296 people shows a significant positive correlation between the proportion of Cambodians and unemployment rate among seniors over the age of 75 in the United States with a correlation coefficient (R) of 0.602 and weighted average of 7.6%. Similarly, the statistical analysis conducted on geographies consisting of 186,734,228 people shows a substantial positive correlation between the proportion of Immigrants from Western Africa and unemployment rate among seniors over the age of 75 in the United States with a correlation coefficient (R) of 0.506 and weighted average of 9.8%, a difference of 27.8%.
Unemployment Among Seniors over 75 years Correlation Summary
| Measurement | Cambodian | Immigrants from Western Africa |
| Minimum | 3.8% | 2.3% |
| Maximum | 46.7% | 85.5% |
| Range | 42.9% | 83.2% |
| Mean | 14.2% | 18.2% |
| Median | 10.5% | 12.3% |
| Interquartile 25% (IQ1) | 5.7% | 8.3% |
| Interquartile 75% (IQ3) | 16.8% | 22.7% |
| Interquartile Range (IQR) | 11.1% | 14.4% |
| Standard Deviation (Sample) | 12.7% | 17.8% |
| Standard Deviation (Population) | 12.3% | 17.6% |
Similar Demographics by Unemployment Among Seniors over 75 years
Demographics Similar to Cambodians by Unemployment Among Seniors over 75 years
In terms of unemployment among seniors over 75 years, the demographic groups most similar to Cambodians are Immigrants from Hong Kong (7.6%, a difference of 0.010%), Immigrants from Eritrea (7.7%, a difference of 0.24%), Immigrants from Norway (7.7%, a difference of 0.45%), Guyanese (7.6%, a difference of 0.51%), and Luxembourger (7.7%, a difference of 0.55%).
| Demographics | Rating | Rank | Unemployment Among Seniors over 75 years |
| South Africans | 100.0 /100 | #26 | Exceptional 7.5% |
| Immigrants | Barbados | 100.0 /100 | #27 | Exceptional 7.6% |
| Immigrants | Israel | 100.0 /100 | #28 | Exceptional 7.6% |
| Immigrants | Iran | 100.0 /100 | #29 | Exceptional 7.6% |
| Immigrants | Sweden | 100.0 /100 | #30 | Exceptional 7.6% |
| Guyanese | 100.0 /100 | #31 | Exceptional 7.6% |
| Immigrants | Hong Kong | 100.0 /100 | #32 | Exceptional 7.6% |
| Cambodians | 100.0 /100 | #33 | Exceptional 7.6% |
| Immigrants | Eritrea | 100.0 /100 | #34 | Exceptional 7.7% |
| Immigrants | Norway | 100.0 /100 | #35 | Exceptional 7.7% |
| Luxembourgers | 100.0 /100 | #36 | Exceptional 7.7% |
| Immigrants | Hungary | 100.0 /100 | #37 | Exceptional 7.7% |
| Kiowa | 100.0 /100 | #38 | Exceptional 7.7% |
| Ugandans | 100.0 /100 | #39 | Exceptional 7.7% |
| Colville | 100.0 /100 | #40 | Exceptional 7.7% |
Demographics Similar to Immigrants from Western Africa by Unemployment Among Seniors over 75 years
In terms of unemployment among seniors over 75 years, the demographic groups most similar to Immigrants from Western Africa are Norwegian (9.8%, a difference of 0.17%), Immigrants from Dominica (9.8%, a difference of 0.23%), Scandinavian (9.7%, a difference of 0.29%), Nonimmigrants (9.8%, a difference of 0.59%), and Immigrants from St. Vincent and the Grenadines (9.8%, a difference of 0.64%).
| Demographics | Rating | Rank | Unemployment Among Seniors over 75 years |
| Carpatho Rusyns | 0.0 /100 | #285 | Tragic 9.7% |
| Nigerians | 0.0 /100 | #286 | Tragic 9.7% |
| Danes | 0.0 /100 | #287 | Tragic 9.7% |
| Canadians | 0.0 /100 | #288 | Tragic 9.7% |
| Czechs | 0.0 /100 | #289 | Tragic 9.7% |
| Sioux | 0.0 /100 | #290 | Tragic 9.7% |
| Scandinavians | 0.0 /100 | #291 | Tragic 9.7% |
| Immigrants | Western Africa | 0.0 /100 | #292 | Tragic 9.8% |
| Norwegians | 0.0 /100 | #293 | Tragic 9.8% |
| Immigrants | Dominica | 0.0 /100 | #294 | Tragic 9.8% |
| Immigrants | Nonimmigrants | 0.0 /100 | #295 | Tragic 9.8% |
| Immigrants | St. Vincent and the Grenadines | 0.0 /100 | #296 | Tragic 9.8% |
| Cherokee | 0.0 /100 | #297 | Tragic 9.8% |
| Lithuanians | 0.0 /100 | #298 | Tragic 9.9% |
| Belgians | 0.0 /100 | #299 | Tragic 9.9% |