Cambodian vs Immigrants from Caribbean Unemployment Among Seniors over 75 years
COMPARE
Cambodian
Immigrants from Caribbean
Unemployment Among Seniors over 75 years
Unemployment Among Seniors over 75 years Comparison
Cambodians
Immigrants from Caribbean
7.6%
UNEMPLOYMENT AMONG SENIORS OVER 75 YEARS
100.0/ 100
METRIC RATING
33rd/ 347
METRIC RANK
8.2%
UNEMPLOYMENT AMONG SENIORS OVER 75 YEARS
99.0/ 100
METRIC RATING
105th/ 347
METRIC RANK
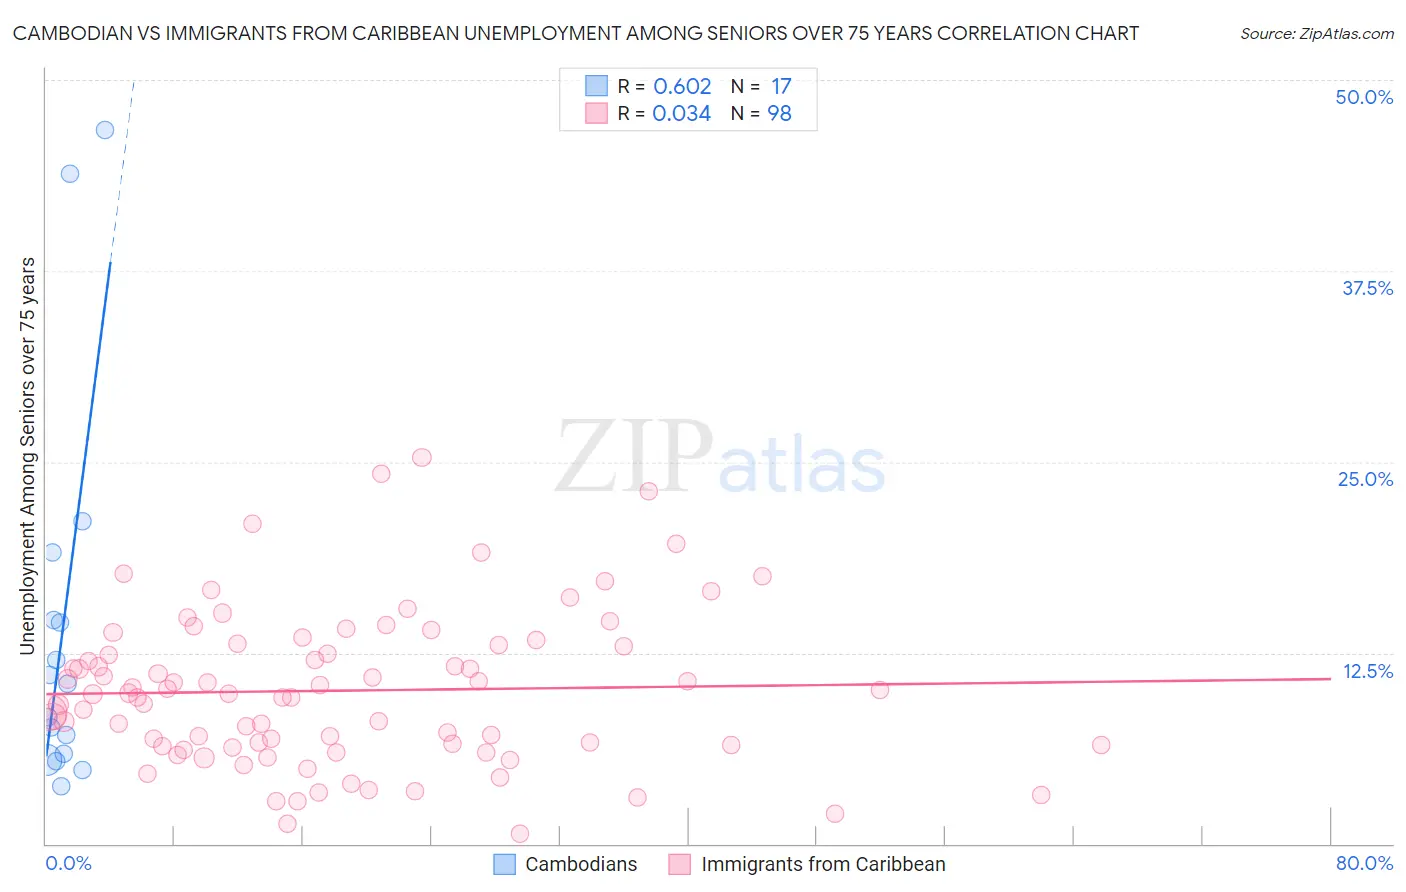
Cambodian vs Immigrants from Caribbean Unemployment Among Seniors over 75 years Correlation Chart
The statistical analysis conducted on geographies consisting of 78,067,296 people shows a significant positive correlation between the proportion of Cambodians and unemployment rate among seniors over the age of 75 in the United States with a correlation coefficient (R) of 0.602 and weighted average of 7.6%. Similarly, the statistical analysis conducted on geographies consisting of 215,050,799 people shows no correlation between the proportion of Immigrants from Caribbean and unemployment rate among seniors over the age of 75 in the United States with a correlation coefficient (R) of 0.034 and weighted average of 8.2%, a difference of 7.3%.
Unemployment Among Seniors over 75 years Correlation Summary
| Measurement | Cambodian | Immigrants from Caribbean |
| Minimum | 3.8% | 0.63% |
| Maximum | 46.7% | 25.3% |
| Range | 42.9% | 24.6% |
| Mean | 14.2% | 10.0% |
| Median | 10.5% | 9.8% |
| Interquartile 25% (IQ1) | 5.7% | 6.5% |
| Interquartile 75% (IQ3) | 16.8% | 13.0% |
| Interquartile Range (IQR) | 11.1% | 6.5% |
| Standard Deviation (Sample) | 12.7% | 5.0% |
| Standard Deviation (Population) | 12.3% | 5.0% |
Similar Demographics by Unemployment Among Seniors over 75 years
Demographics Similar to Cambodians by Unemployment Among Seniors over 75 years
In terms of unemployment among seniors over 75 years, the demographic groups most similar to Cambodians are Immigrants from Hong Kong (7.6%, a difference of 0.010%), Immigrants from Eritrea (7.7%, a difference of 0.24%), Immigrants from Norway (7.7%, a difference of 0.45%), Guyanese (7.6%, a difference of 0.51%), and Luxembourger (7.7%, a difference of 0.55%).
| Demographics | Rating | Rank | Unemployment Among Seniors over 75 years |
| South Africans | 100.0 /100 | #26 | Exceptional 7.5% |
| Immigrants | Barbados | 100.0 /100 | #27 | Exceptional 7.6% |
| Immigrants | Israel | 100.0 /100 | #28 | Exceptional 7.6% |
| Immigrants | Iran | 100.0 /100 | #29 | Exceptional 7.6% |
| Immigrants | Sweden | 100.0 /100 | #30 | Exceptional 7.6% |
| Guyanese | 100.0 /100 | #31 | Exceptional 7.6% |
| Immigrants | Hong Kong | 100.0 /100 | #32 | Exceptional 7.6% |
| Cambodians | 100.0 /100 | #33 | Exceptional 7.6% |
| Immigrants | Eritrea | 100.0 /100 | #34 | Exceptional 7.7% |
| Immigrants | Norway | 100.0 /100 | #35 | Exceptional 7.7% |
| Luxembourgers | 100.0 /100 | #36 | Exceptional 7.7% |
| Immigrants | Hungary | 100.0 /100 | #37 | Exceptional 7.7% |
| Kiowa | 100.0 /100 | #38 | Exceptional 7.7% |
| Ugandans | 100.0 /100 | #39 | Exceptional 7.7% |
| Colville | 100.0 /100 | #40 | Exceptional 7.7% |
Demographics Similar to Immigrants from Caribbean by Unemployment Among Seniors over 75 years
In terms of unemployment among seniors over 75 years, the demographic groups most similar to Immigrants from Caribbean are Immigrants from Honduras (8.2%, a difference of 0.010%), Immigrants from South Central Asia (8.2%, a difference of 0.020%), South American Indian (8.2%, a difference of 0.050%), Sri Lankan (8.2%, a difference of 0.17%), and Immigrants from Panama (8.2%, a difference of 0.20%).
| Demographics | Rating | Rank | Unemployment Among Seniors over 75 years |
| Immigrants | Northern Africa | 99.3 /100 | #98 | Exceptional 8.2% |
| Burmese | 99.2 /100 | #99 | Exceptional 8.2% |
| Immigrants | Kazakhstan | 99.2 /100 | #100 | Exceptional 8.2% |
| Immigrants | Serbia | 99.2 /100 | #101 | Exceptional 8.2% |
| Immigrants | Panama | 99.1 /100 | #102 | Exceptional 8.2% |
| South American Indians | 99.1 /100 | #103 | Exceptional 8.2% |
| Immigrants | South Central Asia | 99.0 /100 | #104 | Exceptional 8.2% |
| Immigrants | Caribbean | 99.0 /100 | #105 | Exceptional 8.2% |
| Immigrants | Honduras | 99.0 /100 | #106 | Exceptional 8.2% |
| Sri Lankans | 98.9 /100 | #107 | Exceptional 8.2% |
| Laotians | 98.8 /100 | #108 | Exceptional 8.2% |
| Immigrants | Lebanon | 98.8 /100 | #109 | Exceptional 8.2% |
| Marshallese | 98.7 /100 | #110 | Exceptional 8.2% |
| French American Indians | 98.7 /100 | #111 | Exceptional 8.2% |
| Immigrants | India | 98.6 /100 | #112 | Exceptional 8.2% |