Cambodian vs Argentinean Unemployment Among Seniors over 75 years
COMPARE
Cambodian
Argentinean
Unemployment Among Seniors over 75 years
Unemployment Among Seniors over 75 years Comparison
Cambodians
Argentineans
7.6%
UNEMPLOYMENT AMONG SENIORS OVER 75 YEARS
100.0/ 100
METRIC RATING
33rd/ 347
METRIC RANK
7.9%
UNEMPLOYMENT AMONG SENIORS OVER 75 YEARS
99.9/ 100
METRIC RATING
65th/ 347
METRIC RANK
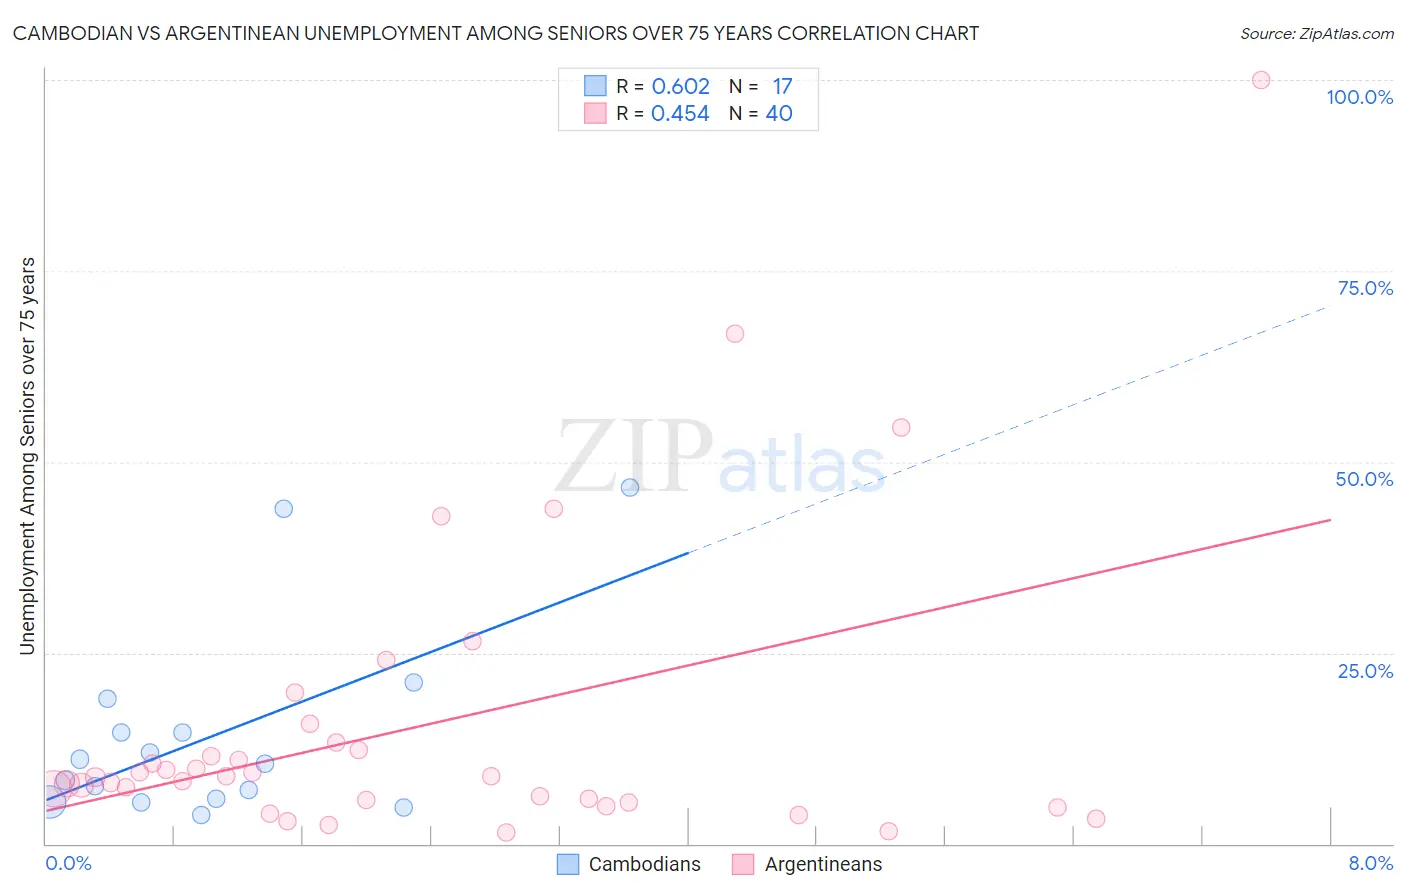
Cambodian vs Argentinean Unemployment Among Seniors over 75 years Correlation Chart
The statistical analysis conducted on geographies consisting of 78,067,296 people shows a significant positive correlation between the proportion of Cambodians and unemployment rate among seniors over the age of 75 in the United States with a correlation coefficient (R) of 0.602 and weighted average of 7.6%. Similarly, the statistical analysis conducted on geographies consisting of 172,532,290 people shows a moderate positive correlation between the proportion of Argentineans and unemployment rate among seniors over the age of 75 in the United States with a correlation coefficient (R) of 0.454 and weighted average of 7.9%, a difference of 3.8%.
Unemployment Among Seniors over 75 years Correlation Summary
| Measurement | Cambodian | Argentinean |
| Minimum | 3.8% | 1.5% |
| Maximum | 46.7% | 100.0% |
| Range | 42.9% | 98.5% |
| Mean | 14.2% | 15.4% |
| Median | 10.5% | 8.8% |
| Interquartile 25% (IQ1) | 5.7% | 5.6% |
| Interquartile 75% (IQ3) | 16.8% | 12.8% |
| Interquartile Range (IQR) | 11.1% | 7.2% |
| Standard Deviation (Sample) | 12.7% | 19.9% |
| Standard Deviation (Population) | 12.3% | 19.7% |
Similar Demographics by Unemployment Among Seniors over 75 years
Demographics Similar to Cambodians by Unemployment Among Seniors over 75 years
In terms of unemployment among seniors over 75 years, the demographic groups most similar to Cambodians are Immigrants from Hong Kong (7.6%, a difference of 0.010%), Immigrants from Eritrea (7.7%, a difference of 0.24%), Immigrants from Norway (7.7%, a difference of 0.45%), Guyanese (7.6%, a difference of 0.51%), and Luxembourger (7.7%, a difference of 0.55%).
| Demographics | Rating | Rank | Unemployment Among Seniors over 75 years |
| South Africans | 100.0 /100 | #26 | Exceptional 7.5% |
| Immigrants | Barbados | 100.0 /100 | #27 | Exceptional 7.6% |
| Immigrants | Israel | 100.0 /100 | #28 | Exceptional 7.6% |
| Immigrants | Iran | 100.0 /100 | #29 | Exceptional 7.6% |
| Immigrants | Sweden | 100.0 /100 | #30 | Exceptional 7.6% |
| Guyanese | 100.0 /100 | #31 | Exceptional 7.6% |
| Immigrants | Hong Kong | 100.0 /100 | #32 | Exceptional 7.6% |
| Cambodians | 100.0 /100 | #33 | Exceptional 7.6% |
| Immigrants | Eritrea | 100.0 /100 | #34 | Exceptional 7.7% |
| Immigrants | Norway | 100.0 /100 | #35 | Exceptional 7.7% |
| Luxembourgers | 100.0 /100 | #36 | Exceptional 7.7% |
| Immigrants | Hungary | 100.0 /100 | #37 | Exceptional 7.7% |
| Kiowa | 100.0 /100 | #38 | Exceptional 7.7% |
| Ugandans | 100.0 /100 | #39 | Exceptional 7.7% |
| Colville | 100.0 /100 | #40 | Exceptional 7.7% |
Demographics Similar to Argentineans by Unemployment Among Seniors over 75 years
In terms of unemployment among seniors over 75 years, the demographic groups most similar to Argentineans are Immigrants from Taiwan (7.9%, a difference of 0.060%), Immigrants from Nicaragua (7.9%, a difference of 0.12%), Immigrants from Albania (7.9%, a difference of 0.19%), Immigrants from Austria (8.0%, a difference of 0.19%), and Uruguayan (7.9%, a difference of 0.22%).
| Demographics | Rating | Rank | Unemployment Among Seniors over 75 years |
| Iranians | 99.9 /100 | #58 | Exceptional 7.9% |
| Indonesians | 99.9 /100 | #59 | Exceptional 7.9% |
| Immigrants | Morocco | 99.9 /100 | #60 | Exceptional 7.9% |
| Uruguayans | 99.9 /100 | #61 | Exceptional 7.9% |
| Immigrants | Albania | 99.9 /100 | #62 | Exceptional 7.9% |
| Immigrants | Nicaragua | 99.9 /100 | #63 | Exceptional 7.9% |
| Immigrants | Taiwan | 99.9 /100 | #64 | Exceptional 7.9% |
| Argentineans | 99.9 /100 | #65 | Exceptional 7.9% |
| Immigrants | Austria | 99.9 /100 | #66 | Exceptional 8.0% |
| Immigrants | Syria | 99.9 /100 | #67 | Exceptional 8.0% |
| Immigrants | South Africa | 99.9 /100 | #68 | Exceptional 8.0% |
| Indians (Asian) | 99.9 /100 | #69 | Exceptional 8.0% |
| Immigrants | Argentina | 99.9 /100 | #70 | Exceptional 8.0% |
| Immigrants | Cambodia | 99.9 /100 | #71 | Exceptional 8.0% |
| Bolivians | 99.9 /100 | #72 | Exceptional 8.0% |