Colombian vs Tsimshian Unemployment Among Ages 20 to 24 years
COMPARE
Colombian
Tsimshian
Unemployment Among Ages 20 to 24 years
Unemployment Among Ages 20 to 24 years Comparison
Colombians
Tsimshian
10.4%
UNEMPLOYMENT AMONG AGES 20 TO 24 YEARS
22.3/ 100
METRIC RATING
198th/ 347
METRIC RANK
18.0%
UNEMPLOYMENT AMONG AGES 20 TO 24 YEARS
0.0/ 100
METRIC RATING
343rd/ 347
METRIC RANK
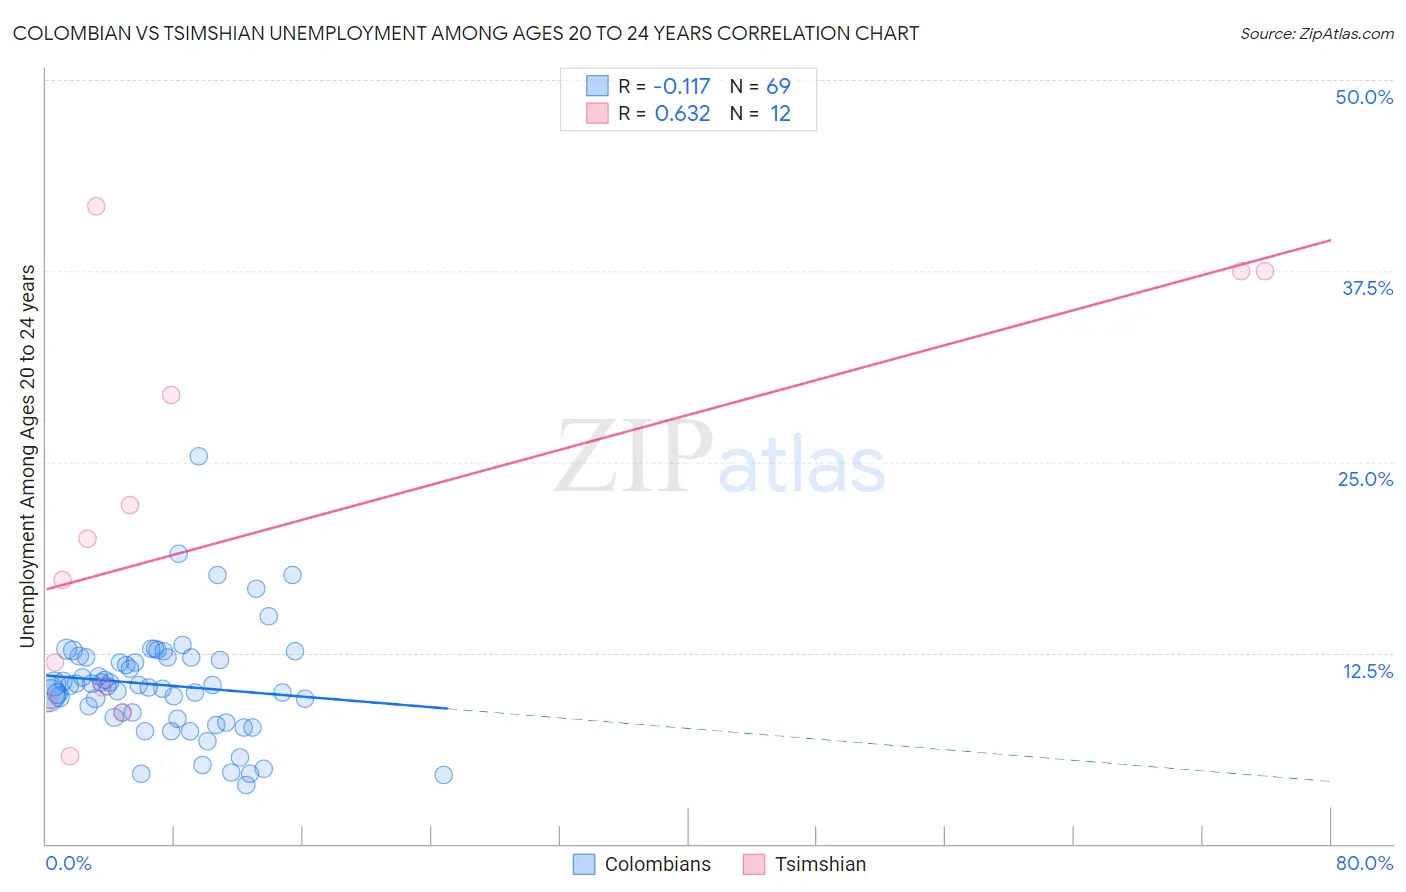
Colombian vs Tsimshian Unemployment Among Ages 20 to 24 years Correlation Chart
The statistical analysis conducted on geographies consisting of 407,071,658 people shows a poor negative correlation between the proportion of Colombians and unemployment rate among population between the ages 20 and 24 in the United States with a correlation coefficient (R) of -0.117 and weighted average of 10.4%. Similarly, the statistical analysis conducted on geographies consisting of 15,555,323 people shows a significant positive correlation between the proportion of Tsimshian and unemployment rate among population between the ages 20 and 24 in the United States with a correlation coefficient (R) of 0.632 and weighted average of 18.0%, a difference of 72.5%.
Unemployment Among Ages 20 to 24 years Correlation Summary
| Measurement | Colombian | Tsimshian |
| Minimum | 3.9% | 5.7% |
| Maximum | 25.4% | 41.7% |
| Range | 21.5% | 36.0% |
| Mean | 10.4% | 20.9% |
| Median | 10.4% | 18.6% |
| Interquartile 25% (IQ1) | 8.3% | 9.8% |
| Interquartile 75% (IQ3) | 12.2% | 33.5% |
| Interquartile Range (IQR) | 3.9% | 23.7% |
| Standard Deviation (Sample) | 3.6% | 12.7% |
| Standard Deviation (Population) | 3.6% | 12.2% |
Similar Demographics by Unemployment Among Ages 20 to 24 years
Demographics Similar to Colombians by Unemployment Among Ages 20 to 24 years
In terms of unemployment among ages 20 to 24 years, the demographic groups most similar to Colombians are Immigrants from Denmark (10.4%, a difference of 0.030%), Portuguese (10.4%, a difference of 0.030%), Russian (10.4%, a difference of 0.060%), Immigrants from Peru (10.4%, a difference of 0.060%), and Immigrants from Middle Africa (10.4%, a difference of 0.080%).
| Demographics | Rating | Rank | Unemployment Among Ages 20 to 24 years |
| Immigrants | Eastern Europe | 25.8 /100 | #191 | Fair 10.4% |
| Ugandans | 25.7 /100 | #192 | Fair 10.4% |
| Immigrants | Portugal | 25.3 /100 | #193 | Fair 10.4% |
| Immigrants | Italy | 25.0 /100 | #194 | Fair 10.4% |
| Egyptians | 24.5 /100 | #195 | Fair 10.4% |
| Immigrants | Philippines | 24.1 /100 | #196 | Fair 10.4% |
| Immigrants | Denmark | 22.8 /100 | #197 | Fair 10.4% |
| Colombians | 22.3 /100 | #198 | Fair 10.4% |
| Portuguese | 21.8 /100 | #199 | Fair 10.4% |
| Russians | 21.2 /100 | #200 | Fair 10.4% |
| Immigrants | Peru | 21.2 /100 | #201 | Fair 10.4% |
| Immigrants | Middle Africa | 20.9 /100 | #202 | Fair 10.4% |
| South Americans | 20.6 /100 | #203 | Fair 10.4% |
| Immigrants | Northern Europe | 19.5 /100 | #204 | Poor 10.4% |
| Cypriots | 18.9 /100 | #205 | Poor 10.4% |
Demographics Similar to Tsimshian by Unemployment Among Ages 20 to 24 years
In terms of unemployment among ages 20 to 24 years, the demographic groups most similar to Tsimshian are Crow (18.7%, a difference of 4.2%), Puerto Rican (16.7%, a difference of 8.0%), Hopi (19.9%, a difference of 10.6%), Navajo (16.1%, a difference of 11.4%), and Yuman (15.8%, a difference of 13.5%).
| Demographics | Rating | Rank | Unemployment Among Ages 20 to 24 years |
| Immigrants | Guyana | 0.0 /100 | #333 | Tragic 13.9% |
| Guyanese | 0.0 /100 | #334 | Tragic 14.0% |
| Sioux | 0.0 /100 | #335 | Tragic 14.2% |
| Pima | 0.0 /100 | #336 | Tragic 14.2% |
| Paiute | 0.0 /100 | #337 | Tragic 14.3% |
| Immigrants | St. Vincent and the Grenadines | 0.0 /100 | #338 | Tragic 14.3% |
| Immigrants | Yemen | 0.0 /100 | #339 | Tragic 14.9% |
| Yuman | 0.0 /100 | #340 | Tragic 15.8% |
| Navajo | 0.0 /100 | #341 | Tragic 16.1% |
| Puerto Ricans | 0.0 /100 | #342 | Tragic 16.7% |
| Tsimshian | 0.0 /100 | #343 | Tragic 18.0% |
| Crow | 0.0 /100 | #344 | Tragic 18.7% |
| Hopi | 0.0 /100 | #345 | Tragic 19.9% |
| Yup'ik | 0.0 /100 | #346 | Tragic 20.9% |
| Inupiat | 0.0 /100 | #347 | Tragic 20.9% |