Cajun vs Nepalese Unemployment Among Ages 20 to 24 years
COMPARE
Cajun
Nepalese
Unemployment Among Ages 20 to 24 years
Unemployment Among Ages 20 to 24 years Comparison
Cajuns
Nepalese
12.0%
UNEMPLOYMENT AMONG AGES 20 TO 24 YEARS
0.0/ 100
METRIC RATING
296th/ 347
METRIC RANK
10.6%
UNEMPLOYMENT AMONG AGES 20 TO 24 YEARS
5.1/ 100
METRIC RATING
224th/ 347
METRIC RANK
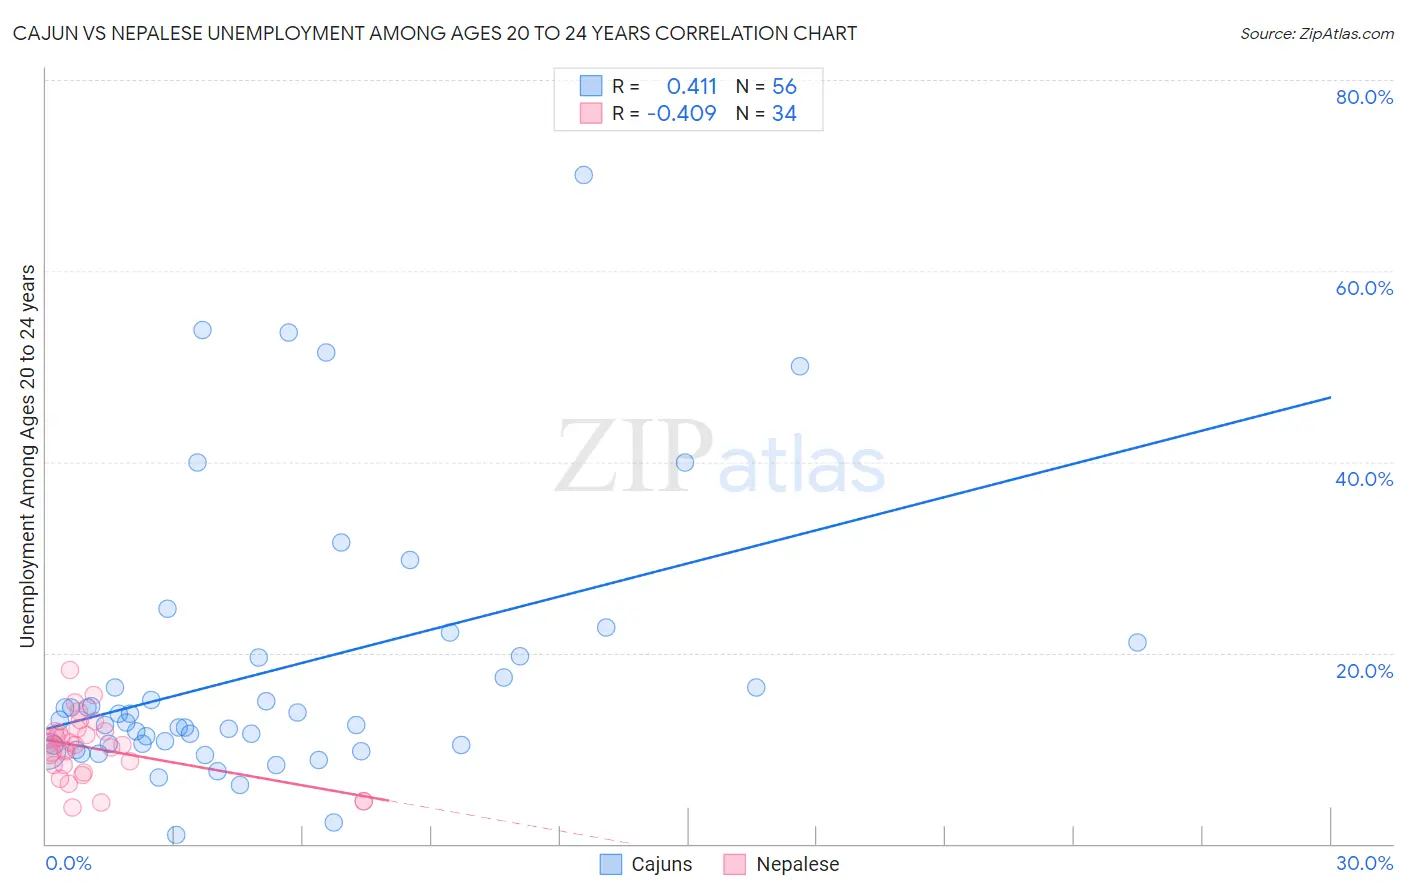
Cajun vs Nepalese Unemployment Among Ages 20 to 24 years Correlation Chart
The statistical analysis conducted on geographies consisting of 146,212,599 people shows a moderate positive correlation between the proportion of Cajuns and unemployment rate among population between the ages 20 and 24 in the United States with a correlation coefficient (R) of 0.411 and weighted average of 12.0%. Similarly, the statistical analysis conducted on geographies consisting of 24,479,281 people shows a moderate negative correlation between the proportion of Nepalese and unemployment rate among population between the ages 20 and 24 in the United States with a correlation coefficient (R) of -0.409 and weighted average of 10.6%, a difference of 13.2%.
Unemployment Among Ages 20 to 24 years Correlation Summary
| Measurement | Cajun | Nepalese |
| Minimum | 0.88% | 3.8% |
| Maximum | 70.0% | 18.2% |
| Range | 69.1% | 14.4% |
| Mean | 18.1% | 10.0% |
| Median | 12.8% | 10.4% |
| Interquartile 25% (IQ1) | 10.3% | 8.2% |
| Interquartile 75% (IQ3) | 19.6% | 11.7% |
| Interquartile Range (IQR) | 9.2% | 3.5% |
| Standard Deviation (Sample) | 14.2% | 3.3% |
| Standard Deviation (Population) | 14.1% | 3.2% |
Similar Demographics by Unemployment Among Ages 20 to 24 years
Demographics Similar to Cajuns by Unemployment Among Ages 20 to 24 years
In terms of unemployment among ages 20 to 24 years, the demographic groups most similar to Cajuns are Blackfeet (12.0%, a difference of 0.010%), Immigrants from Armenia (12.0%, a difference of 0.030%), Immigrants from Belize (12.0%, a difference of 0.21%), Immigrants from Ghana (11.9%, a difference of 0.24%), and Immigrants from Senegal (11.9%, a difference of 0.47%).
| Demographics | Rating | Rank | Unemployment Among Ages 20 to 24 years |
| Belizeans | 0.0 /100 | #289 | Tragic 11.8% |
| Immigrants | Caribbean | 0.0 /100 | #290 | Tragic 11.8% |
| Central American Indians | 0.0 /100 | #291 | Tragic 11.9% |
| Immigrants | Senegal | 0.0 /100 | #292 | Tragic 11.9% |
| Immigrants | Ghana | 0.0 /100 | #293 | Tragic 11.9% |
| Immigrants | Belize | 0.0 /100 | #294 | Tragic 12.0% |
| Immigrants | Armenia | 0.0 /100 | #295 | Tragic 12.0% |
| Cajuns | 0.0 /100 | #296 | Tragic 12.0% |
| Blackfeet | 0.0 /100 | #297 | Tragic 12.0% |
| Lumbee | 0.0 /100 | #298 | Tragic 12.0% |
| Apache | 0.0 /100 | #299 | Tragic 12.0% |
| Spanish American Indians | 0.0 /100 | #300 | Tragic 12.1% |
| Immigrants | Sierra Leone | 0.0 /100 | #301 | Tragic 12.1% |
| Immigrants | Cabo Verde | 0.0 /100 | #302 | Tragic 12.2% |
| Haitians | 0.0 /100 | #303 | Tragic 12.2% |
Demographics Similar to Nepalese by Unemployment Among Ages 20 to 24 years
In terms of unemployment among ages 20 to 24 years, the demographic groups most similar to Nepalese are Immigrants from South America (10.6%, a difference of 0.010%), Immigrants from Costa Rica (10.6%, a difference of 0.040%), Palestinian (10.6%, a difference of 0.040%), Arab (10.6%, a difference of 0.090%), and Mexican American Indian (10.6%, a difference of 0.11%).
| Demographics | Rating | Rank | Unemployment Among Ages 20 to 24 years |
| Cherokee | 9.3 /100 | #217 | Tragic 10.5% |
| Immigrants | Nonimmigrants | 8.8 /100 | #218 | Tragic 10.5% |
| Immigrants | Southern Europe | 8.0 /100 | #219 | Tragic 10.5% |
| Eastern Europeans | 6.9 /100 | #220 | Tragic 10.6% |
| Central Americans | 6.8 /100 | #221 | Tragic 10.6% |
| Immigrants | Poland | 6.4 /100 | #222 | Tragic 10.6% |
| Arabs | 5.6 /100 | #223 | Tragic 10.6% |
| Nepalese | 5.1 /100 | #224 | Tragic 10.6% |
| Immigrants | South America | 5.1 /100 | #225 | Tragic 10.6% |
| Immigrants | Costa Rica | 4.9 /100 | #226 | Tragic 10.6% |
| Palestinians | 4.9 /100 | #227 | Tragic 10.6% |
| Mexican American Indians | 4.6 /100 | #228 | Tragic 10.6% |
| Americans | 4.4 /100 | #229 | Tragic 10.6% |
| French American Indians | 4.1 /100 | #230 | Tragic 10.6% |
| Native Hawaiians | 3.9 /100 | #231 | Tragic 10.6% |