Cajun vs Zimbabwean Unemployment Among Ages 60 to 64 years
COMPARE
Cajun
Zimbabwean
Unemployment Among Ages 60 to 64 years
Unemployment Among Ages 60 to 64 years Comparison
Cajuns
Zimbabweans
4.9%
UNEMPLOYMENT AMONG AGES 60 TO 64 YEARS
12.3/ 100
METRIC RATING
216th/ 347
METRIC RANK
4.5%
UNEMPLOYMENT AMONG AGES 60 TO 64 YEARS
100.0/ 100
METRIC RATING
32nd/ 347
METRIC RANK
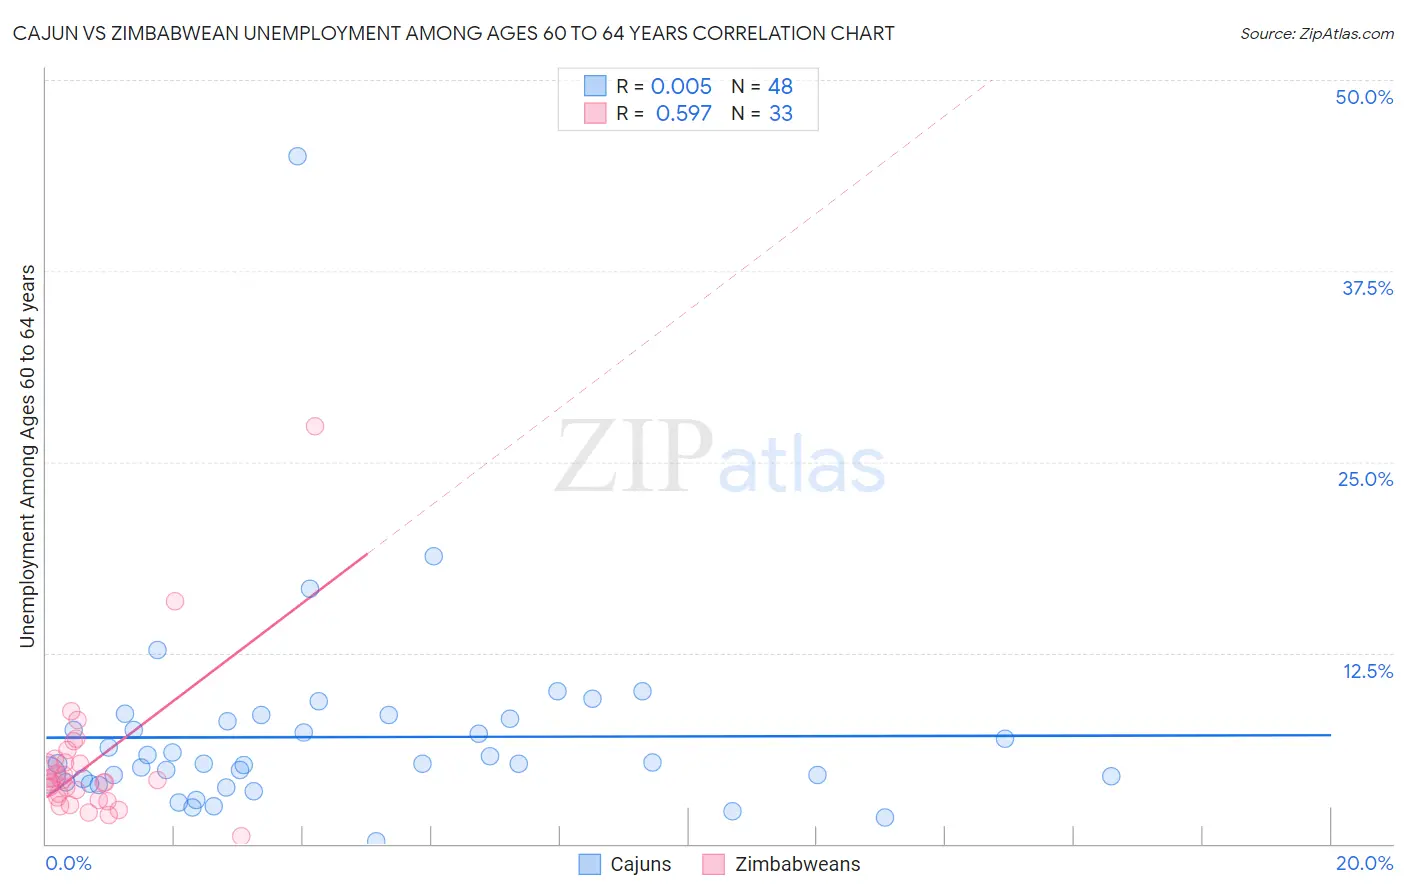
Cajun vs Zimbabwean Unemployment Among Ages 60 to 64 years Correlation Chart
The statistical analysis conducted on geographies consisting of 139,908,047 people shows no correlation between the proportion of Cajuns and unemployment rate among population between the ages 60 and 64 in the United States with a correlation coefficient (R) of 0.005 and weighted average of 4.9%. Similarly, the statistical analysis conducted on geographies consisting of 67,535,579 people shows a substantial positive correlation between the proportion of Zimbabweans and unemployment rate among population between the ages 60 and 64 in the United States with a correlation coefficient (R) of 0.597 and weighted average of 4.5%, a difference of 10.5%.
Unemployment Among Ages 60 to 64 years Correlation Summary
| Measurement | Cajun | Zimbabwean |
| Minimum | 0.20% | 0.50% |
| Maximum | 45.0% | 27.3% |
| Range | 44.8% | 26.8% |
| Mean | 7.0% | 5.3% |
| Median | 5.2% | 4.2% |
| Interquartile 25% (IQ1) | 4.1% | 3.0% |
| Interquartile 75% (IQ3) | 8.1% | 5.5% |
| Interquartile Range (IQR) | 4.0% | 2.5% |
| Standard Deviation (Sample) | 6.6% | 4.8% |
| Standard Deviation (Population) | 6.5% | 4.7% |
Similar Demographics by Unemployment Among Ages 60 to 64 years
Demographics Similar to Cajuns by Unemployment Among Ages 60 to 64 years
In terms of unemployment among ages 60 to 64 years, the demographic groups most similar to Cajuns are Korean (4.9%, a difference of 0.010%), Immigrants from Singapore (4.9%, a difference of 0.020%), Immigrants from Brazil (4.9%, a difference of 0.050%), Immigrants from South Eastern Asia (4.9%, a difference of 0.060%), and Ottawa (4.9%, a difference of 0.060%).
| Demographics | Rating | Rank | Unemployment Among Ages 60 to 64 years |
| Sierra Leoneans | 16.5 /100 | #209 | Poor 4.9% |
| Cherokee | 16.1 /100 | #210 | Poor 4.9% |
| Blackfeet | 15.7 /100 | #211 | Poor 4.9% |
| Moroccans | 15.0 /100 | #212 | Poor 4.9% |
| Eastern Europeans | 14.3 /100 | #213 | Poor 4.9% |
| Immigrants | Russia | 13.7 /100 | #214 | Poor 4.9% |
| Immigrants | South Eastern Asia | 13.1 /100 | #215 | Poor 4.9% |
| Cajuns | 12.3 /100 | #216 | Poor 4.9% |
| Koreans | 12.2 /100 | #217 | Poor 4.9% |
| Immigrants | Singapore | 12.0 /100 | #218 | Poor 4.9% |
| Immigrants | Brazil | 11.7 /100 | #219 | Poor 4.9% |
| Ottawa | 11.6 /100 | #220 | Poor 4.9% |
| Ugandans | 10.5 /100 | #221 | Poor 4.9% |
| Brazilians | 10.1 /100 | #222 | Poor 5.0% |
| Crow | 9.7 /100 | #223 | Tragic 5.0% |
Demographics Similar to Zimbabweans by Unemployment Among Ages 60 to 64 years
In terms of unemployment among ages 60 to 64 years, the demographic groups most similar to Zimbabweans are Immigrants from Eritrea (4.5%, a difference of 0.040%), Carpatho Rusyn (4.5%, a difference of 0.050%), Immigrants from Venezuela (4.5%, a difference of 0.11%), Cuban (4.5%, a difference of 0.13%), and Belgian (4.5%, a difference of 0.31%).
| Demographics | Rating | Rank | Unemployment Among Ages 60 to 64 years |
| Yugoslavians | 100.0 /100 | #25 | Exceptional 4.4% |
| Czechs | 100.0 /100 | #26 | Exceptional 4.4% |
| Immigrants | Iraq | 100.0 /100 | #27 | Exceptional 4.5% |
| Immigrants | Nepal | 100.0 /100 | #28 | Exceptional 4.5% |
| Cubans | 100.0 /100 | #29 | Exceptional 4.5% |
| Immigrants | Venezuela | 100.0 /100 | #30 | Exceptional 4.5% |
| Immigrants | Eritrea | 100.0 /100 | #31 | Exceptional 4.5% |
| Zimbabweans | 100.0 /100 | #32 | Exceptional 4.5% |
| Carpatho Rusyns | 100.0 /100 | #33 | Exceptional 4.5% |
| Belgians | 100.0 /100 | #34 | Exceptional 4.5% |
| Germans | 100.0 /100 | #35 | Exceptional 4.5% |
| Venezuelans | 100.0 /100 | #36 | Exceptional 4.5% |
| Immigrants | Portugal | 100.0 /100 | #37 | Exceptional 4.5% |
| Native Hawaiians | 100.0 /100 | #38 | Exceptional 4.5% |
| Iraqis | 100.0 /100 | #39 | Exceptional 4.5% |