Cajun vs Immigrants from Australia Unemployment Among Ages 65 to 74 years
COMPARE
Cajun
Immigrants from Australia
Unemployment Among Ages 65 to 74 years
Unemployment Among Ages 65 to 74 years Comparison
Cajuns
Immigrants from Australia
5.5%
UNEMPLOYMENT AMONG AGES 65 TO 74 YEARS
1.8/ 100
METRIC RATING
238th/ 347
METRIC RANK
5.3%
UNEMPLOYMENT AMONG AGES 65 TO 74 YEARS
89.1/ 100
METRIC RATING
121st/ 347
METRIC RANK
Cajun vs Immigrants from Australia Unemployment Among Ages 65 to 74 years Correlation Chart
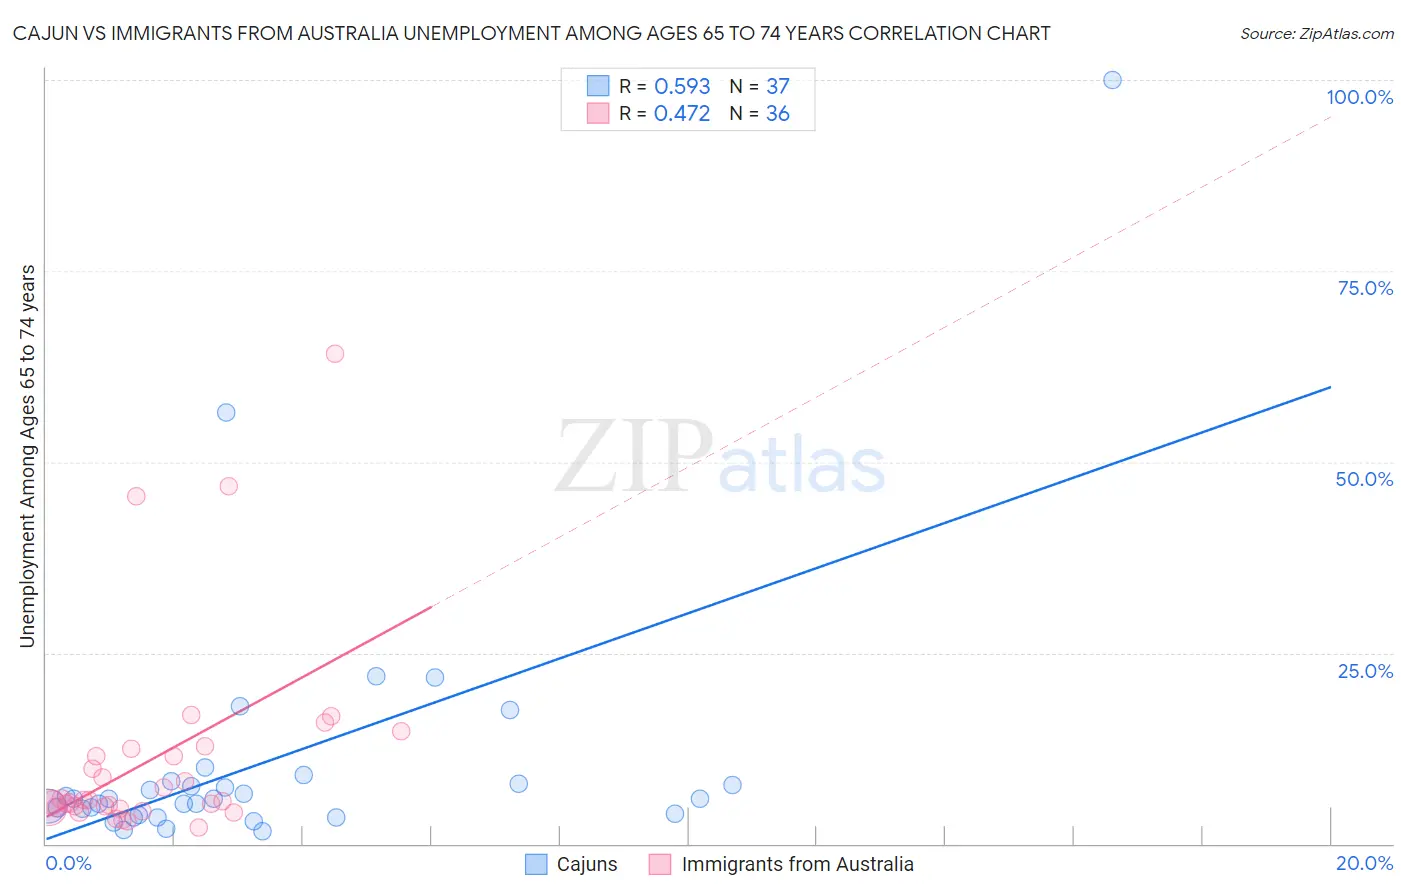
The statistical analysis conducted on geographies consisting of 137,241,864 people shows a substantial positive correlation between the proportion of Cajuns and unemployment rate among population between the ages 65 and 74 in the United States with a correlation coefficient (R) of 0.593 and weighted average of 5.5%. Similarly, the statistical analysis conducted on geographies consisting of 210,212,724 people shows a moderate positive correlation between the proportion of Immigrants from Australia and unemployment rate among population between the ages 65 and 74 in the United States with a correlation coefficient (R) of 0.472 and weighted average of 5.3%, a difference of 5.2%.
Unemployment Among Ages 65 to 74 years Correlation Summary
| Measurement | Cajun | Immigrants from Australia |
| Minimum | 1.7% | 2.1% |
| Maximum | 100.0% | 64.1% |
| Range | 98.3% | 62.0% |
| Mean | 10.8% | 11.1% |
| Median | 5.9% | 5.6% |
| Interquartile 25% (IQ1) | 3.9% | 4.8% |
| Interquartile 75% (IQ3) | 8.0% | 12.0% |
| Interquartile Range (IQR) | 4.1% | 7.2% |
| Standard Deviation (Sample) | 17.8% | 13.4% |
| Standard Deviation (Population) | 17.6% | 13.2% |
Similar Demographics by Unemployment Among Ages 65 to 74 years
Demographics Similar to Cajuns by Unemployment Among Ages 65 to 74 years
In terms of unemployment among ages 65 to 74 years, the demographic groups most similar to Cajuns are German Russian (5.5%, a difference of 0.080%), Hopi (5.5%, a difference of 0.16%), Immigrants from Belize (5.5%, a difference of 0.16%), French American Indian (5.5%, a difference of 0.17%), and Peruvian (5.5%, a difference of 0.17%).
| Demographics | Rating | Rank | Unemployment Among Ages 65 to 74 years |
| Israelis | 2.5 /100 | #231 | Tragic 5.5% |
| Nigerians | 2.5 /100 | #232 | Tragic 5.5% |
| South American Indians | 2.3 /100 | #233 | Tragic 5.5% |
| French American Indians | 2.2 /100 | #234 | Tragic 5.5% |
| Peruvians | 2.2 /100 | #235 | Tragic 5.5% |
| Hopi | 2.2 /100 | #236 | Tragic 5.5% |
| Immigrants | Belize | 2.2 /100 | #237 | Tragic 5.5% |
| Cajuns | 1.8 /100 | #238 | Tragic 5.5% |
| German Russians | 1.6 /100 | #239 | Tragic 5.5% |
| Ghanaians | 1.4 /100 | #240 | Tragic 5.6% |
| Cree | 1.4 /100 | #241 | Tragic 5.6% |
| Immigrants | Ghana | 1.4 /100 | #242 | Tragic 5.6% |
| Immigrants | Peru | 1.3 /100 | #243 | Tragic 5.6% |
| Immigrants | Micronesia | 0.9 /100 | #244 | Tragic 5.6% |
| Immigrants | Greece | 0.9 /100 | #245 | Tragic 5.6% |
Demographics Similar to Immigrants from Australia by Unemployment Among Ages 65 to 74 years
In terms of unemployment among ages 65 to 74 years, the demographic groups most similar to Immigrants from Australia are Immigrants from Canada (5.3%, a difference of 0.010%), Czechoslovakian (5.3%, a difference of 0.040%), Immigrants from Fiji (5.3%, a difference of 0.070%), Immigrants from Switzerland (5.3%, a difference of 0.070%), and Immigrants from Belarus (5.3%, a difference of 0.090%).
| Demographics | Rating | Rank | Unemployment Among Ages 65 to 74 years |
| Asians | 91.1 /100 | #114 | Exceptional 5.3% |
| Immigrants | Turkey | 90.8 /100 | #115 | Exceptional 5.3% |
| Australians | 90.4 /100 | #116 | Exceptional 5.3% |
| Immigrants | Korea | 90.2 /100 | #117 | Exceptional 5.3% |
| Immigrants | Belarus | 90.1 /100 | #118 | Exceptional 5.3% |
| Immigrants | Fiji | 89.9 /100 | #119 | Excellent 5.3% |
| Immigrants | Switzerland | 89.9 /100 | #120 | Excellent 5.3% |
| Immigrants | Australia | 89.1 /100 | #121 | Excellent 5.3% |
| Immigrants | Canada | 89.0 /100 | #122 | Excellent 5.3% |
| Czechoslovakians | 88.6 /100 | #123 | Excellent 5.3% |
| Immigrants | Ukraine | 87.5 /100 | #124 | Excellent 5.3% |
| Pakistanis | 87.5 /100 | #125 | Excellent 5.3% |
| Immigrants | South Eastern Asia | 87.2 /100 | #126 | Excellent 5.3% |
| Immigrants | North America | 86.7 /100 | #127 | Excellent 5.3% |
| Immigrants | Hong Kong | 86.5 /100 | #128 | Excellent 5.3% |