Burmese vs Cypriot Unemployment Among Ages 30 to 34 years
COMPARE
Burmese
Cypriot
Unemployment Among Ages 30 to 34 years
Unemployment Among Ages 30 to 34 years Comparison
Burmese
Cypriots
5.1%
UNEMPLOYMENT AMONG AGES 30 TO 34 YEARS
96.5/ 100
METRIC RATING
67th/ 347
METRIC RANK
5.1%
UNEMPLOYMENT AMONG AGES 30 TO 34 YEARS
98.4/ 100
METRIC RATING
47th/ 347
METRIC RANK
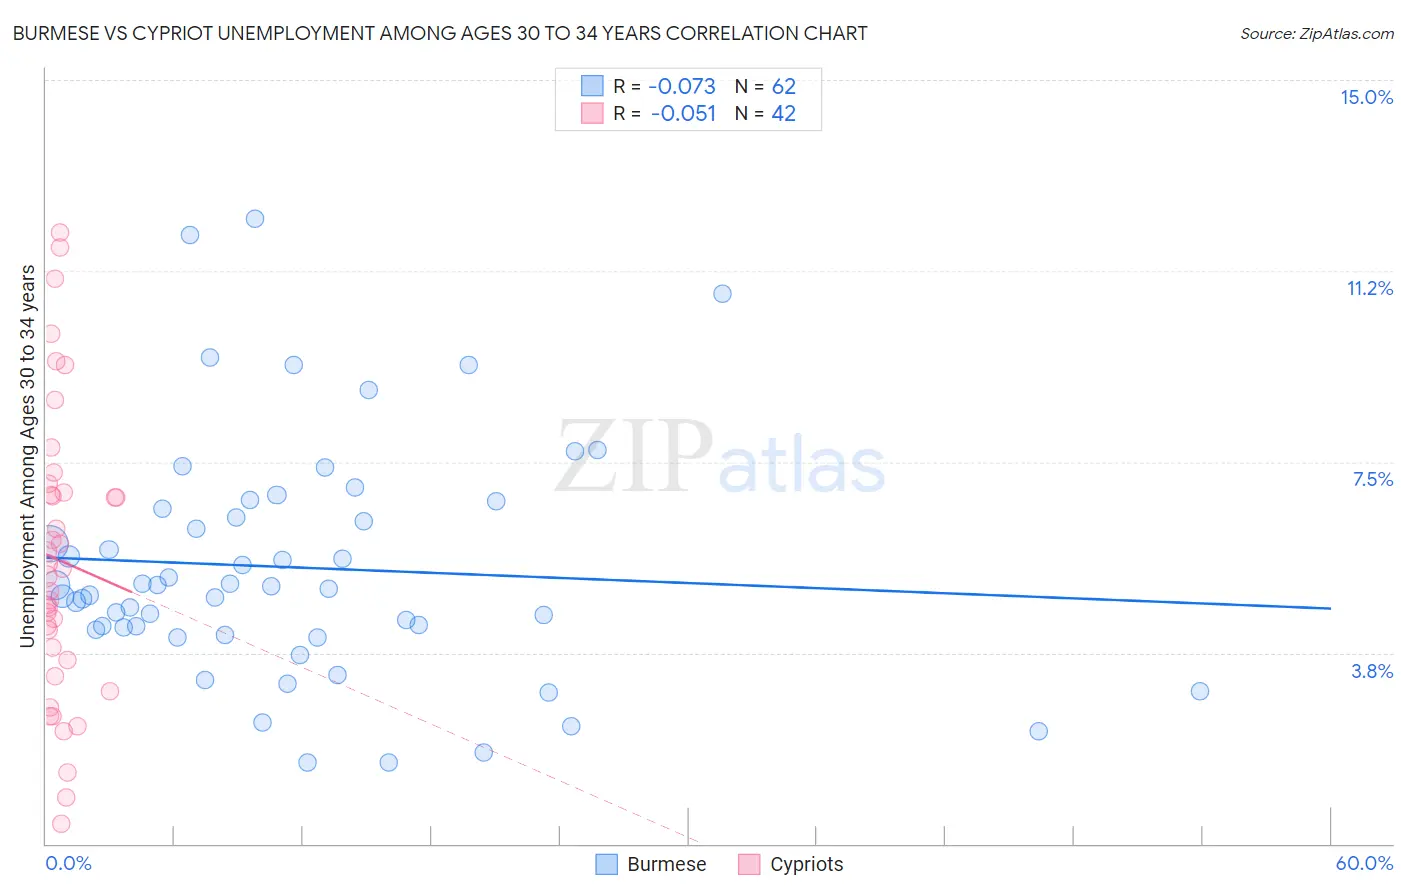
Burmese vs Cypriot Unemployment Among Ages 30 to 34 years Correlation Chart
The statistical analysis conducted on geographies consisting of 431,223,716 people shows a slight negative correlation between the proportion of Burmese and unemployment rate among population between the ages 30 and 34 in the United States with a correlation coefficient (R) of -0.073 and weighted average of 5.1%. Similarly, the statistical analysis conducted on geographies consisting of 61,053,204 people shows a slight negative correlation between the proportion of Cypriots and unemployment rate among population between the ages 30 and 34 in the United States with a correlation coefficient (R) of -0.051 and weighted average of 5.1%, a difference of 1.5%.
Unemployment Among Ages 30 to 34 years Correlation Summary
| Measurement | Burmese | Cypriot |
| Minimum | 1.6% | 0.40% |
| Maximum | 12.3% | 12.0% |
| Range | 10.7% | 11.6% |
| Mean | 5.4% | 5.6% |
| Median | 5.0% | 5.3% |
| Interquartile 25% (IQ1) | 4.2% | 3.6% |
| Interquartile 75% (IQ3) | 6.6% | 6.9% |
| Interquartile Range (IQR) | 2.4% | 3.3% |
| Standard Deviation (Sample) | 2.3% | 2.8% |
| Standard Deviation (Population) | 2.3% | 2.8% |
Demographics Similar to Burmese and Cypriots by Unemployment Among Ages 30 to 34 years
In terms of unemployment among ages 30 to 34 years, the demographic groups most similar to Burmese are Immigrants from Zimbabwe (5.1%, a difference of 0.13%), Immigrants from Japan (5.1%, a difference of 0.20%), Immigrants from Eastern Asia (5.1%, a difference of 0.27%), Belgian (5.1%, a difference of 0.30%), and Immigrants from France (5.1%, a difference of 0.31%). Similarly, the demographic groups most similar to Cypriots are Assyrian/Chaldean/Syriac (5.1%, a difference of 0.020%), Immigrants from Malaysia (5.1%, a difference of 0.14%), Puget Sound Salish (5.1%, a difference of 0.21%), Turkish (5.1%, a difference of 0.25%), and Immigrants from Burma/Myanmar (5.1%, a difference of 0.28%).
| Demographics | Rating | Rank | Unemployment Among Ages 30 to 34 years |
| Cypriots | 98.4 /100 | #47 | Exceptional 5.1% |
| Assyrians/Chaldeans/Syriacs | 98.4 /100 | #48 | Exceptional 5.1% |
| Immigrants | Malaysia | 98.3 /100 | #49 | Exceptional 5.1% |
| Puget Sound Salish | 98.2 /100 | #50 | Exceptional 5.1% |
| Turks | 98.2 /100 | #51 | Exceptional 5.1% |
| Immigrants | Burma/Myanmar | 98.1 /100 | #52 | Exceptional 5.1% |
| Cubans | 98.1 /100 | #53 | Exceptional 5.1% |
| Immigrants | Morocco | 97.9 /100 | #54 | Exceptional 5.1% |
| Chinese | 97.7 /100 | #55 | Exceptional 5.1% |
| Immigrants | Serbia | 97.4 /100 | #56 | Exceptional 5.1% |
| Immigrants | China | 97.2 /100 | #57 | Exceptional 5.1% |
| Asians | 97.2 /100 | #58 | Exceptional 5.1% |
| Swedes | 97.1 /100 | #59 | Exceptional 5.1% |
| Immigrants | Somalia | 97.1 /100 | #60 | Exceptional 5.1% |
| Indians (Asian) | 97.0 /100 | #61 | Exceptional 5.1% |
| Immigrants | France | 97.0 /100 | #62 | Exceptional 5.1% |
| Belgians | 97.0 /100 | #63 | Exceptional 5.1% |
| Immigrants | Eastern Asia | 96.9 /100 | #64 | Exceptional 5.1% |
| Immigrants | Japan | 96.8 /100 | #65 | Exceptional 5.1% |
| Immigrants | Zimbabwe | 96.7 /100 | #66 | Exceptional 5.1% |
| Burmese | 96.5 /100 | #67 | Exceptional 5.1% |