Burmese vs Filipino Unemployment Among Ages 55 to 59 years
COMPARE
Burmese
Filipino
Unemployment Among Ages 55 to 59 years
Unemployment Among Ages 55 to 59 years Comparison
Burmese
Filipinos
4.5%
UNEMPLOYMENT AMONG AGES 55 TO 59 YEARS
99.7/ 100
METRIC RATING
54th/ 347
METRIC RANK
4.6%
UNEMPLOYMENT AMONG AGES 55 TO 59 YEARS
98.8/ 100
METRIC RATING
70th/ 347
METRIC RANK
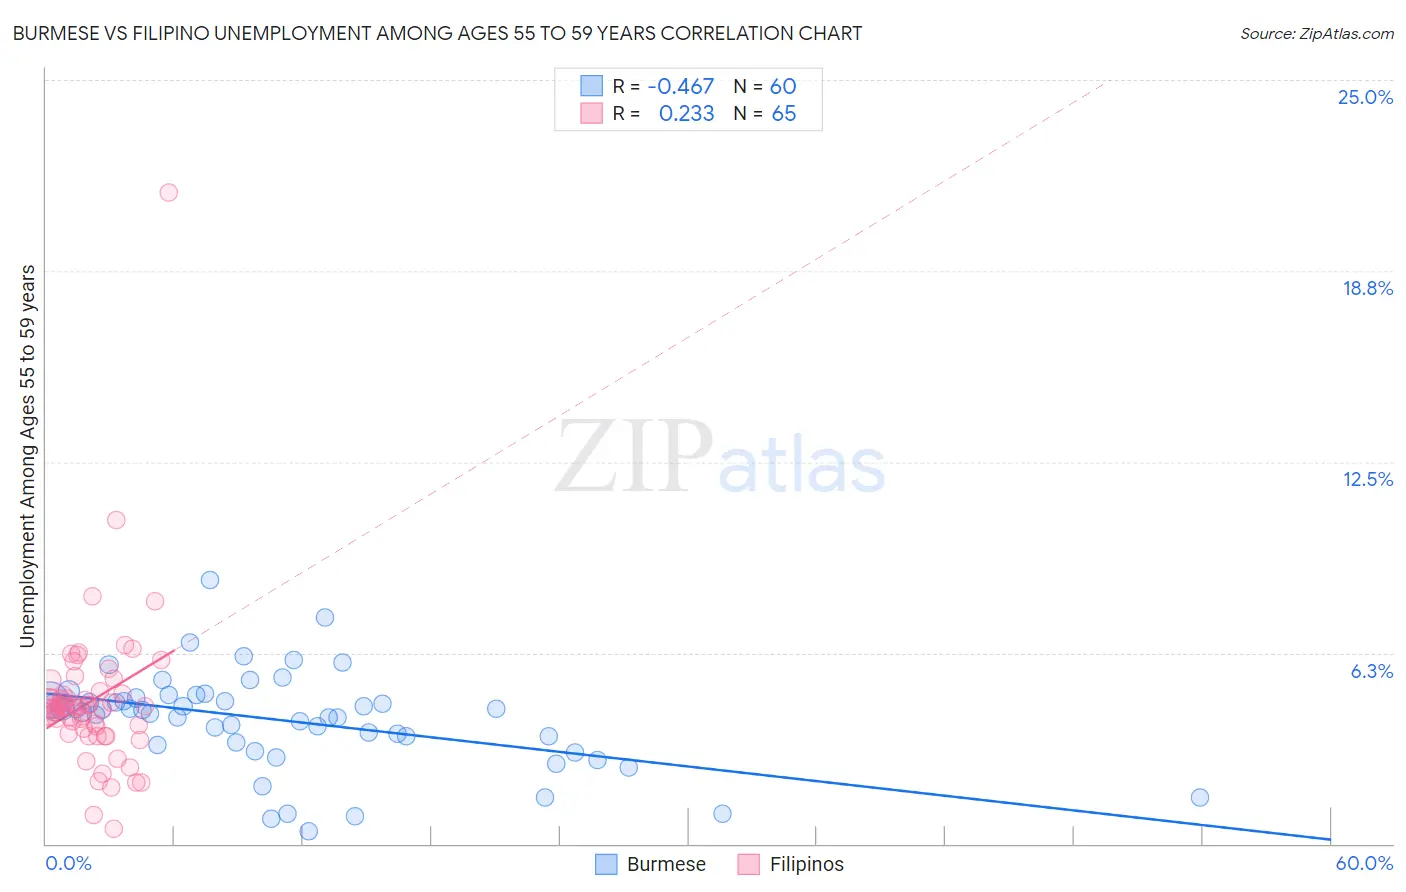
Burmese vs Filipino Unemployment Among Ages 55 to 59 years Correlation Chart
The statistical analysis conducted on geographies consisting of 424,209,965 people shows a moderate negative correlation between the proportion of Burmese and unemployment rate among population between the ages 55 and 59 in the United States with a correlation coefficient (R) of -0.467 and weighted average of 4.5%. Similarly, the statistical analysis conducted on geographies consisting of 243,640,495 people shows a weak positive correlation between the proportion of Filipinos and unemployment rate among population between the ages 55 and 59 in the United States with a correlation coefficient (R) of 0.233 and weighted average of 4.6%, a difference of 1.5%.
Unemployment Among Ages 55 to 59 years Correlation Summary
| Measurement | Burmese | Filipino |
| Minimum | 0.40% | 0.50% |
| Maximum | 8.6% | 21.3% |
| Range | 8.2% | 20.8% |
| Mean | 4.0% | 4.7% |
| Median | 4.3% | 4.5% |
| Interquartile 25% (IQ1) | 3.3% | 3.7% |
| Interquartile 75% (IQ3) | 4.7% | 5.0% |
| Interquartile Range (IQR) | 1.5% | 1.3% |
| Standard Deviation (Sample) | 1.6% | 2.6% |
| Standard Deviation (Population) | 1.6% | 2.6% |
Demographics Similar to Burmese and Filipinos by Unemployment Among Ages 55 to 59 years
In terms of unemployment among ages 55 to 59 years, the demographic groups most similar to Burmese are Immigrants from Middle Africa (4.5%, a difference of 0.0%), Scottish (4.5%, a difference of 0.010%), Immigrants from Nepal (4.5%, a difference of 0.090%), Welsh (4.5%, a difference of 0.15%), and Northern European (4.5%, a difference of 0.16%). Similarly, the demographic groups most similar to Filipinos are Immigrants from Jordan (4.6%, a difference of 0.030%), Immigrants from Taiwan (4.6%, a difference of 0.070%), Czechoslovakian (4.6%, a difference of 0.20%), Immigrants from Micronesia (4.6%, a difference of 0.21%), and Ugandan (4.6%, a difference of 0.22%).
| Demographics | Rating | Rank | Unemployment Among Ages 55 to 59 years |
| Scottish | 99.7 /100 | #52 | Exceptional 4.5% |
| Immigrants | Middle Africa | 99.7 /100 | #53 | Exceptional 4.5% |
| Burmese | 99.7 /100 | #54 | Exceptional 4.5% |
| Immigrants | Nepal | 99.6 /100 | #55 | Exceptional 4.5% |
| Welsh | 99.6 /100 | #56 | Exceptional 4.5% |
| Northern Europeans | 99.6 /100 | #57 | Exceptional 4.5% |
| Okinawans | 99.6 /100 | #58 | Exceptional 4.5% |
| Immigrants | Uganda | 99.5 /100 | #59 | Exceptional 4.6% |
| Dutch | 99.5 /100 | #60 | Exceptional 4.6% |
| Immigrants | Argentina | 99.5 /100 | #61 | Exceptional 4.6% |
| Slovenes | 99.3 /100 | #62 | Exceptional 4.6% |
| Immigrants | South Central Asia | 99.3 /100 | #63 | Exceptional 4.6% |
| Argentineans | 99.1 /100 | #64 | Exceptional 4.6% |
| Sudanese | 99.1 /100 | #65 | Exceptional 4.6% |
| Mongolians | 99.0 /100 | #66 | Exceptional 4.6% |
| Ugandans | 99.0 /100 | #67 | Exceptional 4.6% |
| Immigrants | Micronesia | 99.0 /100 | #68 | Exceptional 4.6% |
| Czechoslovakians | 99.0 /100 | #69 | Exceptional 4.6% |
| Filipinos | 98.8 /100 | #70 | Exceptional 4.6% |
| Immigrants | Jordan | 98.7 /100 | #71 | Exceptional 4.6% |
| Immigrants | Taiwan | 98.7 /100 | #72 | Exceptional 4.6% |