Immigrants from Caribbean vs Filipino Unemployment Among Ages 55 to 59 years
COMPARE
Immigrants from Caribbean
Filipino
Unemployment Among Ages 55 to 59 years
Unemployment Among Ages 55 to 59 years Comparison
Immigrants from Caribbean
Filipinos
5.2%
UNEMPLOYMENT AMONG AGES 55 TO 59 YEARS
0.1/ 100
METRIC RATING
264th/ 347
METRIC RANK
4.6%
UNEMPLOYMENT AMONG AGES 55 TO 59 YEARS
98.8/ 100
METRIC RATING
70th/ 347
METRIC RANK
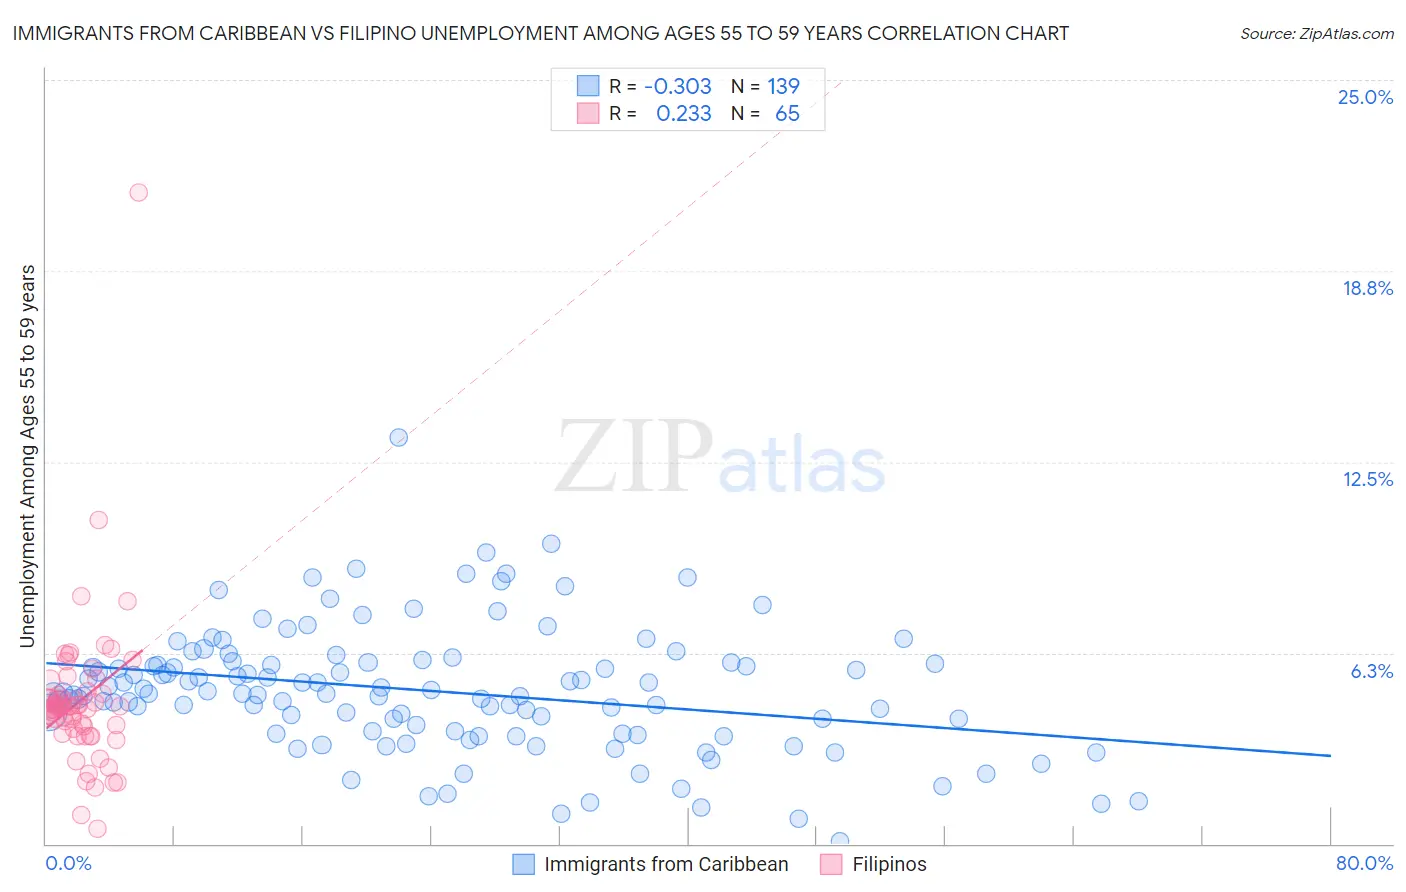
Immigrants from Caribbean vs Filipino Unemployment Among Ages 55 to 59 years Correlation Chart
The statistical analysis conducted on geographies consisting of 413,134,103 people shows a mild negative correlation between the proportion of Immigrants from Caribbean and unemployment rate among population between the ages 55 and 59 in the United States with a correlation coefficient (R) of -0.303 and weighted average of 5.2%. Similarly, the statistical analysis conducted on geographies consisting of 243,640,495 people shows a weak positive correlation between the proportion of Filipinos and unemployment rate among population between the ages 55 and 59 in the United States with a correlation coefficient (R) of 0.233 and weighted average of 4.6%, a difference of 12.0%.
Unemployment Among Ages 55 to 59 years Correlation Summary
| Measurement | Immigrants from Caribbean | Filipino |
| Minimum | 0.10% | 0.50% |
| Maximum | 13.3% | 21.3% |
| Range | 13.2% | 20.8% |
| Mean | 5.0% | 4.7% |
| Median | 4.9% | 4.5% |
| Interquartile 25% (IQ1) | 3.7% | 3.7% |
| Interquartile 75% (IQ3) | 5.9% | 5.0% |
| Interquartile Range (IQR) | 2.2% | 1.3% |
| Standard Deviation (Sample) | 2.0% | 2.6% |
| Standard Deviation (Population) | 2.0% | 2.6% |
Similar Demographics by Unemployment Among Ages 55 to 59 years
Demographics Similar to Immigrants from Caribbean by Unemployment Among Ages 55 to 59 years
In terms of unemployment among ages 55 to 59 years, the demographic groups most similar to Immigrants from Caribbean are Yaqui (5.2%, a difference of 0.060%), Jamaican (5.2%, a difference of 0.090%), Immigrants from Senegal (5.2%, a difference of 0.090%), Immigrants from Sierra Leone (5.2%, a difference of 0.10%), and Mexican (5.2%, a difference of 0.10%).
| Demographics | Rating | Rank | Unemployment Among Ages 55 to 59 years |
| Central Americans | 0.2 /100 | #257 | Tragic 5.1% |
| Salvadorans | 0.2 /100 | #258 | Tragic 5.1% |
| Immigrants | West Indies | 0.2 /100 | #259 | Tragic 5.1% |
| Immigrants | Western Africa | 0.2 /100 | #260 | Tragic 5.1% |
| Africans | 0.1 /100 | #261 | Tragic 5.1% |
| Immigrants | El Salvador | 0.1 /100 | #262 | Tragic 5.1% |
| Immigrants | Sierra Leone | 0.1 /100 | #263 | Tragic 5.2% |
| Immigrants | Caribbean | 0.1 /100 | #264 | Tragic 5.2% |
| Yaqui | 0.1 /100 | #265 | Tragic 5.2% |
| Jamaicans | 0.1 /100 | #266 | Tragic 5.2% |
| Immigrants | Senegal | 0.1 /100 | #267 | Tragic 5.2% |
| Mexicans | 0.1 /100 | #268 | Tragic 5.2% |
| Tsimshian | 0.1 /100 | #269 | Tragic 5.2% |
| Ute | 0.1 /100 | #270 | Tragic 5.2% |
| Cree | 0.1 /100 | #271 | Tragic 5.2% |
Demographics Similar to Filipinos by Unemployment Among Ages 55 to 59 years
In terms of unemployment among ages 55 to 59 years, the demographic groups most similar to Filipinos are Immigrants from Jordan (4.6%, a difference of 0.030%), Immigrants from Taiwan (4.6%, a difference of 0.070%), Bhutanese (4.6%, a difference of 0.14%), Czechoslovakian (4.6%, a difference of 0.20%), and Immigrants from Micronesia (4.6%, a difference of 0.21%).
| Demographics | Rating | Rank | Unemployment Among Ages 55 to 59 years |
| Immigrants | South Central Asia | 99.3 /100 | #63 | Exceptional 4.6% |
| Argentineans | 99.1 /100 | #64 | Exceptional 4.6% |
| Sudanese | 99.1 /100 | #65 | Exceptional 4.6% |
| Mongolians | 99.0 /100 | #66 | Exceptional 4.6% |
| Ugandans | 99.0 /100 | #67 | Exceptional 4.6% |
| Immigrants | Micronesia | 99.0 /100 | #68 | Exceptional 4.6% |
| Czechoslovakians | 99.0 /100 | #69 | Exceptional 4.6% |
| Filipinos | 98.8 /100 | #70 | Exceptional 4.6% |
| Immigrants | Jordan | 98.7 /100 | #71 | Exceptional 4.6% |
| Immigrants | Taiwan | 98.7 /100 | #72 | Exceptional 4.6% |
| Bhutanese | 98.6 /100 | #73 | Exceptional 4.6% |
| Croatians | 98.5 /100 | #74 | Exceptional 4.6% |
| Immigrants | Iraq | 98.5 /100 | #75 | Exceptional 4.6% |
| Immigrants | Bosnia and Herzegovina | 98.3 /100 | #76 | Exceptional 4.6% |
| Scotch-Irish | 98.3 /100 | #77 | Exceptional 4.6% |