Welsh vs Cypriot Unemployment Among Ages 30 to 34 years
COMPARE
Welsh
Cypriot
Unemployment Among Ages 30 to 34 years
Unemployment Among Ages 30 to 34 years Comparison
Welsh
Cypriots
5.4%
UNEMPLOYMENT AMONG AGES 30 TO 34 YEARS
56.3/ 100
METRIC RATING
165th/ 347
METRIC RANK
5.1%
UNEMPLOYMENT AMONG AGES 30 TO 34 YEARS
98.4/ 100
METRIC RATING
47th/ 347
METRIC RANK
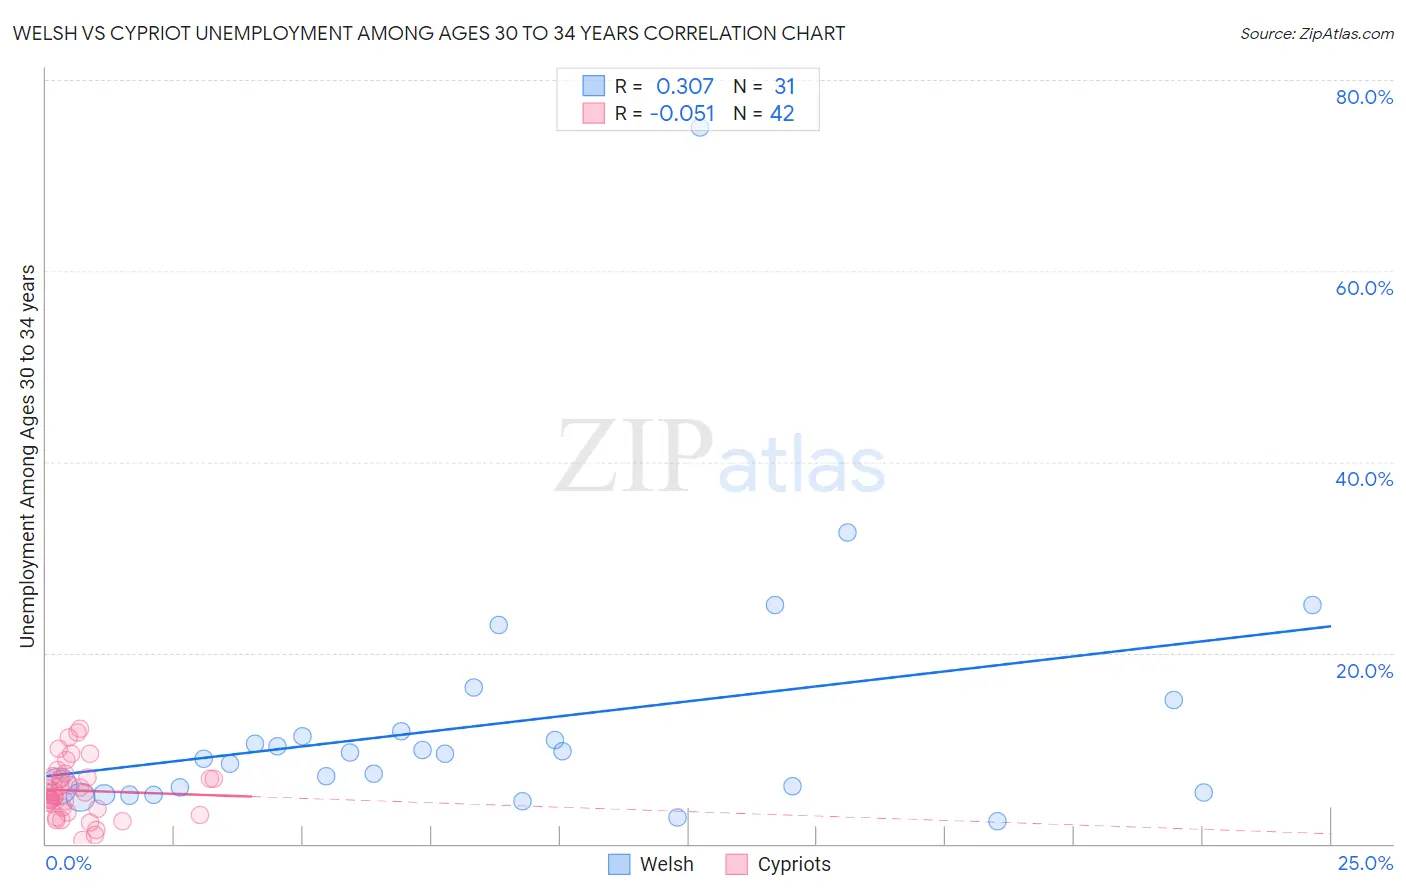
Welsh vs Cypriot Unemployment Among Ages 30 to 34 years Correlation Chart
The statistical analysis conducted on geographies consisting of 469,062,666 people shows a mild positive correlation between the proportion of Welsh and unemployment rate among population between the ages 30 and 34 in the United States with a correlation coefficient (R) of 0.307 and weighted average of 5.4%. Similarly, the statistical analysis conducted on geographies consisting of 61,053,204 people shows a slight negative correlation between the proportion of Cypriots and unemployment rate among population between the ages 30 and 34 in the United States with a correlation coefficient (R) of -0.051 and weighted average of 5.1%, a difference of 7.2%.
Unemployment Among Ages 30 to 34 years Correlation Summary
| Measurement | Welsh | Cypriot |
| Minimum | 2.3% | 0.40% |
| Maximum | 75.0% | 12.0% |
| Range | 72.7% | 11.6% |
| Mean | 12.6% | 5.6% |
| Median | 9.5% | 5.3% |
| Interquartile 25% (IQ1) | 5.4% | 3.6% |
| Interquartile 75% (IQ3) | 11.8% | 6.9% |
| Interquartile Range (IQR) | 6.4% | 3.3% |
| Standard Deviation (Sample) | 13.6% | 2.8% |
| Standard Deviation (Population) | 13.4% | 2.8% |
Similar Demographics by Unemployment Among Ages 30 to 34 years
Demographics Similar to Welsh by Unemployment Among Ages 30 to 34 years
In terms of unemployment among ages 30 to 34 years, the demographic groups most similar to Welsh are Immigrants from Thailand (5.4%, a difference of 0.050%), Basque (5.4%, a difference of 0.070%), Arab (5.4%, a difference of 0.10%), English (5.4%, a difference of 0.11%), and Brazilian (5.4%, a difference of 0.14%).
| Demographics | Rating | Rank | Unemployment Among Ages 30 to 34 years |
| Immigrants | Belarus | 62.7 /100 | #158 | Good 5.4% |
| Immigrants | Croatia | 61.0 /100 | #159 | Good 5.4% |
| Immigrants | Scotland | 59.3 /100 | #160 | Average 5.4% |
| Austrians | 59.0 /100 | #161 | Average 5.4% |
| Brazilians | 58.2 /100 | #162 | Average 5.4% |
| Arabs | 57.7 /100 | #163 | Average 5.4% |
| Basques | 57.3 /100 | #164 | Average 5.4% |
| Welsh | 56.3 /100 | #165 | Average 5.4% |
| Immigrants | Thailand | 55.6 /100 | #166 | Average 5.4% |
| English | 54.8 /100 | #167 | Average 5.4% |
| South Americans | 52.9 /100 | #168 | Average 5.4% |
| Immigrants | Israel | 52.9 /100 | #169 | Average 5.4% |
| Dutch | 52.6 /100 | #170 | Average 5.5% |
| Scottish | 51.8 /100 | #171 | Average 5.5% |
| Immigrants | Austria | 51.3 /100 | #172 | Average 5.5% |
Demographics Similar to Cypriots by Unemployment Among Ages 30 to 34 years
In terms of unemployment among ages 30 to 34 years, the demographic groups most similar to Cypriots are Assyrian/Chaldean/Syriac (5.1%, a difference of 0.020%), Immigrants from Congo (5.1%, a difference of 0.030%), Immigrants from Malaysia (5.1%, a difference of 0.14%), Puget Sound Salish (5.1%, a difference of 0.21%), and Turkish (5.1%, a difference of 0.25%).
| Demographics | Rating | Rank | Unemployment Among Ages 30 to 34 years |
| Immigrants | Vietnam | 98.9 /100 | #40 | Exceptional 5.0% |
| Immigrants | Eastern Africa | 98.9 /100 | #41 | Exceptional 5.0% |
| Immigrants | Hong Kong | 98.8 /100 | #42 | Exceptional 5.0% |
| Soviet Union | 98.8 /100 | #43 | Exceptional 5.0% |
| Immigrants | Belgium | 98.7 /100 | #44 | Exceptional 5.1% |
| Yugoslavians | 98.6 /100 | #45 | Exceptional 5.1% |
| Immigrants | Congo | 98.4 /100 | #46 | Exceptional 5.1% |
| Cypriots | 98.4 /100 | #47 | Exceptional 5.1% |
| Assyrians/Chaldeans/Syriacs | 98.4 /100 | #48 | Exceptional 5.1% |
| Immigrants | Malaysia | 98.3 /100 | #49 | Exceptional 5.1% |
| Puget Sound Salish | 98.2 /100 | #50 | Exceptional 5.1% |
| Turks | 98.2 /100 | #51 | Exceptional 5.1% |
| Immigrants | Burma/Myanmar | 98.1 /100 | #52 | Exceptional 5.1% |
| Cubans | 98.1 /100 | #53 | Exceptional 5.1% |
| Immigrants | Morocco | 97.9 /100 | #54 | Exceptional 5.1% |