British West Indian vs Sudanese Male Unemployment
COMPARE
British West Indian
Sudanese
Male Unemployment
Male Unemployment Comparison
British West Indians
Sudanese
7.3%
MALE UNEMPLOYMENT
0.0/ 100
METRIC RATING
319th/ 347
METRIC RANK
4.8%
MALE UNEMPLOYMENT
99.8/ 100
METRIC RATING
31st/ 347
METRIC RANK
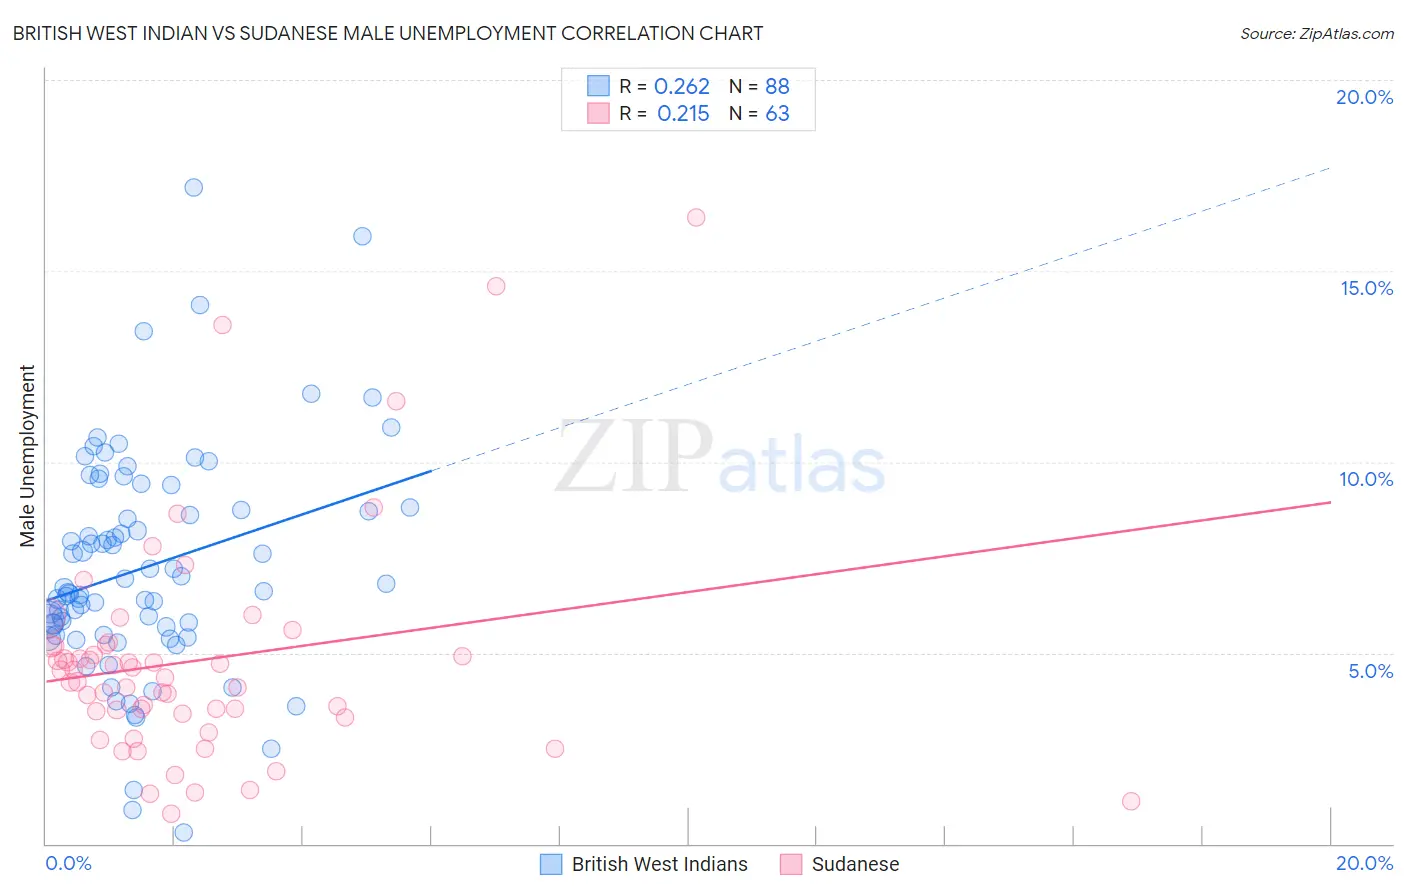
British West Indian vs Sudanese Male Unemployment Correlation Chart
The statistical analysis conducted on geographies consisting of 152,492,993 people shows a weak positive correlation between the proportion of British West Indians and unemployment rate among males in the United States with a correlation coefficient (R) of 0.262 and weighted average of 7.3%. Similarly, the statistical analysis conducted on geographies consisting of 110,013,962 people shows a weak positive correlation between the proportion of Sudanese and unemployment rate among males in the United States with a correlation coefficient (R) of 0.215 and weighted average of 4.8%, a difference of 51.2%.
Male Unemployment Correlation Summary
| Measurement | British West Indian | Sudanese |
| Minimum | 0.30% | 0.80% |
| Maximum | 17.2% | 16.4% |
| Range | 16.9% | 15.6% |
| Mean | 7.2% | 4.8% |
| Median | 6.7% | 4.4% |
| Interquartile 25% (IQ1) | 5.6% | 3.4% |
| Interquartile 75% (IQ3) | 8.8% | 5.2% |
| Interquartile Range (IQR) | 3.2% | 1.8% |
| Standard Deviation (Sample) | 2.9% | 3.0% |
| Standard Deviation (Population) | 2.9% | 2.9% |
Similar Demographics by Male Unemployment
Demographics Similar to British West Indians by Male Unemployment
In terms of male unemployment, the demographic groups most similar to British West Indians are Colville (7.4%, a difference of 0.90%), Immigrants from St. Vincent and the Grenadines (7.5%, a difference of 2.3%), Cape Verdean (7.1%, a difference of 2.5%), Immigrants from Cabo Verde (7.5%, a difference of 2.6%), and Guyanese (7.1%, a difference of 2.6%).
| Demographics | Rating | Rank | Male Unemployment |
| Lumbee | 0.0 /100 | #312 | Tragic 6.9% |
| Immigrants | Dominica | 0.0 /100 | #313 | Tragic 7.0% |
| Immigrants | Barbados | 0.0 /100 | #314 | Tragic 7.1% |
| Houma | 0.0 /100 | #315 | Tragic 7.1% |
| Immigrants | Guyana | 0.0 /100 | #316 | Tragic 7.1% |
| Guyanese | 0.0 /100 | #317 | Tragic 7.1% |
| Cape Verdeans | 0.0 /100 | #318 | Tragic 7.1% |
| British West Indians | 0.0 /100 | #319 | Tragic 7.3% |
| Colville | 0.0 /100 | #320 | Tragic 7.4% |
| Immigrants | St. Vincent and the Grenadines | 0.0 /100 | #321 | Tragic 7.5% |
| Immigrants | Cabo Verde | 0.0 /100 | #322 | Tragic 7.5% |
| Immigrants | Grenada | 0.0 /100 | #323 | Tragic 7.6% |
| Dominicans | 0.0 /100 | #324 | Tragic 7.6% |
| Shoshone | 0.0 /100 | #325 | Tragic 7.6% |
| Immigrants | Dominican Republic | 0.0 /100 | #326 | Tragic 7.6% |
Demographics Similar to Sudanese by Male Unemployment
In terms of male unemployment, the demographic groups most similar to Sudanese are Immigrants from Nepal (4.8%, a difference of 0.010%), British (4.8%, a difference of 0.25%), Latvian (4.8%, a difference of 0.31%), Welsh (4.8%, a difference of 0.40%), and Scottish (4.8%, a difference of 0.56%).
| Demographics | Rating | Rank | Male Unemployment |
| Immigrants | South Central Asia | 99.9 /100 | #24 | Exceptional 4.8% |
| Zimbabweans | 99.9 /100 | #25 | Exceptional 4.8% |
| Dutch | 99.9 /100 | #26 | Exceptional 4.8% |
| Belgians | 99.9 /100 | #27 | Exceptional 4.8% |
| Bulgarians | 99.8 /100 | #28 | Exceptional 4.8% |
| Scottish | 99.8 /100 | #29 | Exceptional 4.8% |
| British | 99.8 /100 | #30 | Exceptional 4.8% |
| Sudanese | 99.8 /100 | #31 | Exceptional 4.8% |
| Immigrants | Nepal | 99.8 /100 | #32 | Exceptional 4.8% |
| Latvians | 99.7 /100 | #33 | Exceptional 4.8% |
| Welsh | 99.7 /100 | #34 | Exceptional 4.8% |
| Paraguayans | 99.5 /100 | #35 | Exceptional 4.9% |
| Immigrants | Singapore | 99.4 /100 | #36 | Exceptional 4.9% |
| Scotch-Irish | 99.4 /100 | #37 | Exceptional 4.9% |
| Immigrants | Bosnia and Herzegovina | 99.4 /100 | #38 | Exceptional 4.9% |