British West Indian vs Sudanese 3rd Grade
COMPARE
British West Indian
Sudanese
3rd Grade
3rd Grade Comparison
British West Indians
Sudanese
97.0%
3RD GRADE
0.0/ 100
METRIC RATING
292nd/ 347
METRIC RANK
97.5%
3RD GRADE
4.1/ 100
METRIC RATING
226th/ 347
METRIC RANK
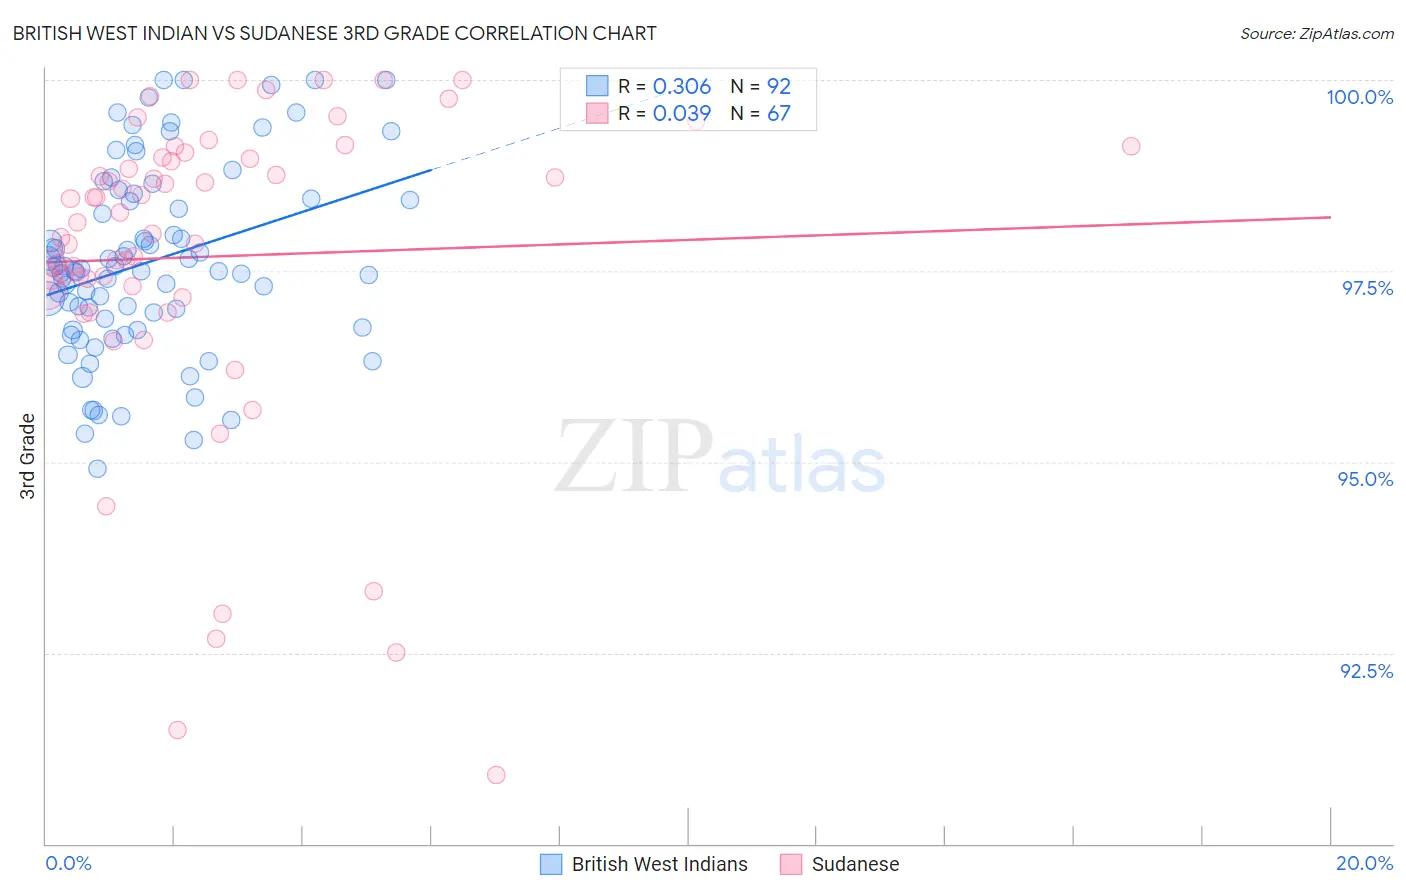
British West Indian vs Sudanese 3rd Grade Correlation Chart
The statistical analysis conducted on geographies consisting of 152,691,173 people shows a mild positive correlation between the proportion of British West Indians and percentage of population with at least 3rd grade education in the United States with a correlation coefficient (R) of 0.306 and weighted average of 97.0%. Similarly, the statistical analysis conducted on geographies consisting of 110,145,984 people shows no correlation between the proportion of Sudanese and percentage of population with at least 3rd grade education in the United States with a correlation coefficient (R) of 0.039 and weighted average of 97.5%, a difference of 0.48%.
3rd Grade Correlation Summary
| Measurement | British West Indian | Sudanese |
| Minimum | 94.9% | 90.9% |
| Maximum | 100.0% | 100.0% |
| Range | 5.1% | 9.1% |
| Mean | 97.6% | 97.7% |
| Median | 97.5% | 98.1% |
| Interquartile 25% (IQ1) | 96.8% | 97.2% |
| Interquartile 75% (IQ3) | 98.4% | 99.0% |
| Interquartile Range (IQR) | 1.6% | 1.8% |
| Standard Deviation (Sample) | 1.2% | 2.1% |
| Standard Deviation (Population) | 1.2% | 2.1% |
Similar Demographics by 3rd Grade
Demographics Similar to British West Indians by 3rd Grade
In terms of 3rd grade, the demographic groups most similar to British West Indians are Immigrants from Portugal (97.0%, a difference of 0.010%), Immigrants from Afghanistan (97.0%, a difference of 0.010%), Immigrants from Grenada (97.0%, a difference of 0.030%), Immigrants from Thailand (97.1%, a difference of 0.040%), and Malaysian (97.0%, a difference of 0.040%).
| Demographics | Rating | Rank | 3rd Grade |
| Immigrants | Hong Kong | 0.0 /100 | #285 | Tragic 97.1% |
| Immigrants | Barbados | 0.0 /100 | #286 | Tragic 97.1% |
| Immigrants | St. Vincent and the Grenadines | 0.0 /100 | #287 | Tragic 97.1% |
| Immigrants | West Indies | 0.0 /100 | #288 | Tragic 97.1% |
| Immigrants | Thailand | 0.0 /100 | #289 | Tragic 97.1% |
| Immigrants | Portugal | 0.0 /100 | #290 | Tragic 97.0% |
| Immigrants | Afghanistan | 0.0 /100 | #291 | Tragic 97.0% |
| British West Indians | 0.0 /100 | #292 | Tragic 97.0% |
| Immigrants | Grenada | 0.0 /100 | #293 | Tragic 97.0% |
| Malaysians | 0.0 /100 | #294 | Tragic 97.0% |
| Immigrants | Eritrea | 0.0 /100 | #295 | Tragic 97.0% |
| Immigrants | Immigrants | 0.0 /100 | #296 | Tragic 96.9% |
| Haitians | 0.0 /100 | #297 | Tragic 96.9% |
| Immigrants | Dominica | 0.0 /100 | #298 | Tragic 96.9% |
| Somalis | 0.0 /100 | #299 | Tragic 96.8% |
Demographics Similar to Sudanese by 3rd Grade
In terms of 3rd grade, the demographic groups most similar to Sudanese are Tongan (97.5%, a difference of 0.0%), Sierra Leonean (97.5%, a difference of 0.010%), Immigrants from Syria (97.5%, a difference of 0.010%), Bahamian (97.5%, a difference of 0.010%), and Immigrants from Panama (97.5%, a difference of 0.020%).
| Demographics | Rating | Rank | 3rd Grade |
| Immigrants | Panama | 5.2 /100 | #219 | Tragic 97.5% |
| Immigrants | Morocco | 5.0 /100 | #220 | Tragic 97.5% |
| Uruguayans | 5.0 /100 | #221 | Tragic 97.5% |
| Sierra Leoneans | 4.6 /100 | #222 | Tragic 97.5% |
| Immigrants | Syria | 4.4 /100 | #223 | Tragic 97.5% |
| Bahamians | 4.4 /100 | #224 | Tragic 97.5% |
| Tongans | 4.3 /100 | #225 | Tragic 97.5% |
| Sudanese | 4.1 /100 | #226 | Tragic 97.5% |
| Immigrants | Sudan | 3.4 /100 | #227 | Tragic 97.5% |
| Sub-Saharan Africans | 3.2 /100 | #228 | Tragic 97.5% |
| Senegalese | 3.0 /100 | #229 | Tragic 97.5% |
| Immigrants | Pakistan | 2.7 /100 | #230 | Tragic 97.5% |
| Immigrants | Costa Rica | 2.7 /100 | #231 | Tragic 97.5% |
| Immigrants | Western Asia | 2.6 /100 | #232 | Tragic 97.5% |
| Immigrants | Malaysia | 2.4 /100 | #233 | Tragic 97.5% |