British West Indian vs Korean Unemployment Among Ages 16 to 19 years
COMPARE
British West Indian
Korean
Unemployment Among Ages 16 to 19 years
Unemployment Among Ages 16 to 19 years Comparison
British West Indians
Koreans
24.0%
UNEMPLOYMENT AMONG AGES 16 TO 19 YEARS
0.0/ 100
METRIC RATING
331st/ 347
METRIC RANK
17.5%
UNEMPLOYMENT AMONG AGES 16 TO 19 YEARS
61.0/ 100
METRIC RATING
159th/ 347
METRIC RANK
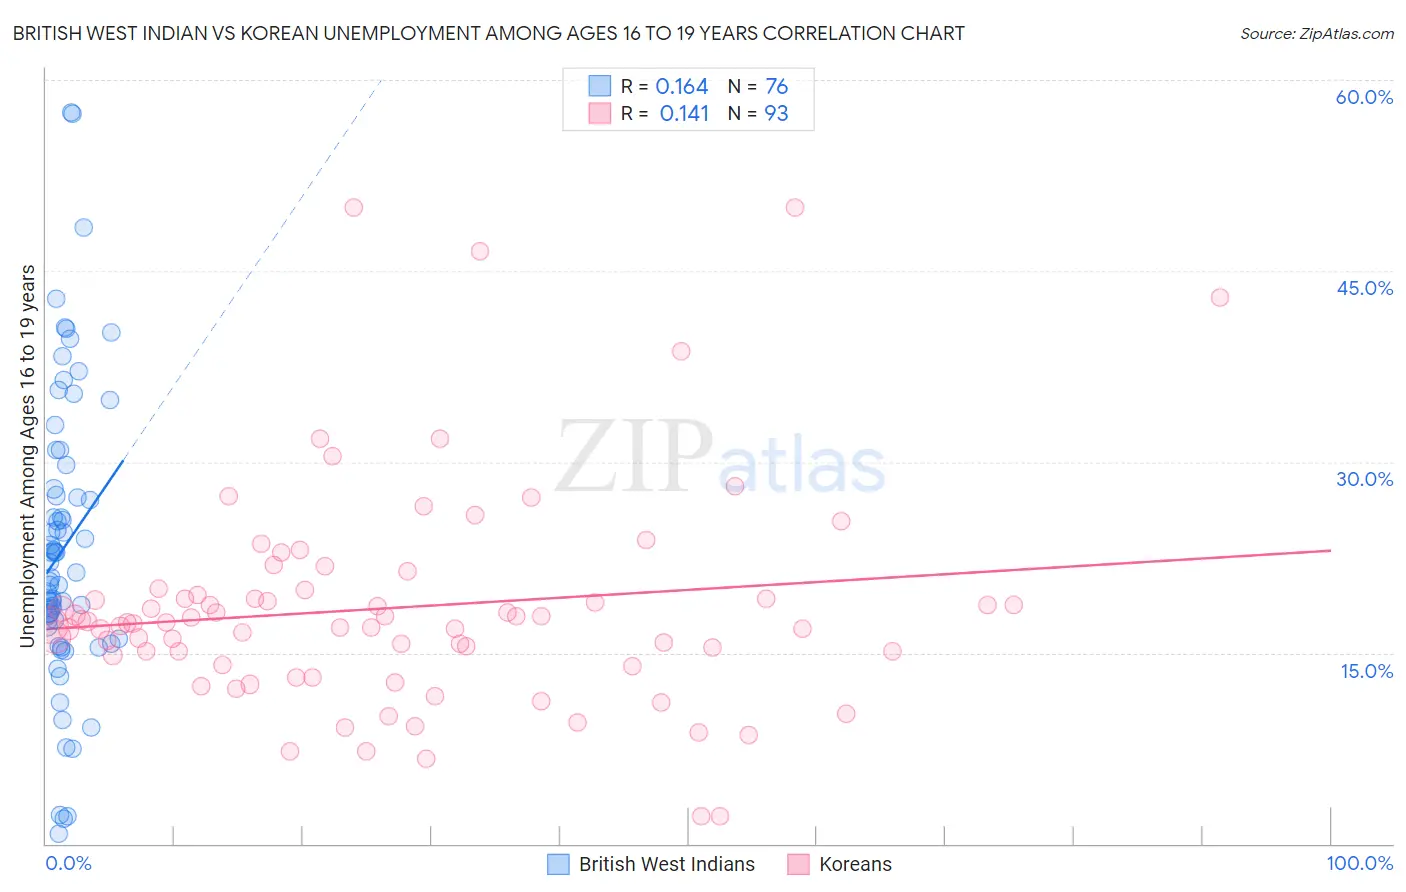
British West Indian vs Korean Unemployment Among Ages 16 to 19 years Correlation Chart
The statistical analysis conducted on geographies consisting of 149,818,612 people shows a poor positive correlation between the proportion of British West Indians and unemployment rate among population between the ages 16 and 19 in the United States with a correlation coefficient (R) of 0.164 and weighted average of 24.0%. Similarly, the statistical analysis conducted on geographies consisting of 473,448,884 people shows a poor positive correlation between the proportion of Koreans and unemployment rate among population between the ages 16 and 19 in the United States with a correlation coefficient (R) of 0.141 and weighted average of 17.5%, a difference of 37.1%.
Unemployment Among Ages 16 to 19 years Correlation Summary
| Measurement | British West Indian | Korean |
| Minimum | 0.80% | 2.2% |
| Maximum | 57.4% | 50.0% |
| Range | 56.6% | 47.8% |
| Mean | 23.2% | 18.5% |
| Median | 21.1% | 17.4% |
| Interquartile 25% (IQ1) | 17.3% | 14.4% |
| Interquartile 75% (IQ3) | 27.6% | 19.7% |
| Interquartile Range (IQR) | 10.3% | 5.3% |
| Standard Deviation (Sample) | 11.4% | 8.6% |
| Standard Deviation (Population) | 11.3% | 8.6% |
Similar Demographics by Unemployment Among Ages 16 to 19 years
Demographics Similar to British West Indians by Unemployment Among Ages 16 to 19 years
In terms of unemployment among ages 16 to 19 years, the demographic groups most similar to British West Indians are Immigrants from Barbados (24.0%, a difference of 0.17%), Dominican (23.6%, a difference of 1.4%), Paiute (24.4%, a difference of 1.6%), Tlingit-Haida (23.5%, a difference of 1.8%), and Immigrants from Dominican Republic (23.3%, a difference of 2.9%).
| Demographics | Rating | Rank | Unemployment Among Ages 16 to 19 years |
| Immigrants | Armenia | 0.0 /100 | #324 | Tragic 22.6% |
| Trinidadians and Tobagonians | 0.0 /100 | #325 | Tragic 22.6% |
| Immigrants | Trinidad and Tobago | 0.0 /100 | #326 | Tragic 23.1% |
| Pima | 0.0 /100 | #327 | Tragic 23.1% |
| Immigrants | Dominican Republic | 0.0 /100 | #328 | Tragic 23.3% |
| Tlingit-Haida | 0.0 /100 | #329 | Tragic 23.5% |
| Dominicans | 0.0 /100 | #330 | Tragic 23.6% |
| British West Indians | 0.0 /100 | #331 | Tragic 24.0% |
| Immigrants | Barbados | 0.0 /100 | #332 | Tragic 24.0% |
| Paiute | 0.0 /100 | #333 | Tragic 24.4% |
| Guyanese | 0.0 /100 | #334 | Tragic 24.8% |
| Arapaho | 0.0 /100 | #335 | Tragic 25.2% |
| Kiowa | 0.0 /100 | #336 | Tragic 25.2% |
| Immigrants | Guyana | 0.0 /100 | #337 | Tragic 25.5% |
| Immigrants | St. Vincent and the Grenadines | 0.0 /100 | #338 | Tragic 25.7% |
Demographics Similar to Koreans by Unemployment Among Ages 16 to 19 years
In terms of unemployment among ages 16 to 19 years, the demographic groups most similar to Koreans are Ukrainian (17.5%, a difference of 0.020%), Immigrants from Denmark (17.5%, a difference of 0.040%), Immigrants from Norway (17.5%, a difference of 0.060%), Egyptian (17.5%, a difference of 0.060%), and Immigrants from China (17.5%, a difference of 0.16%).
| Demographics | Rating | Rank | Unemployment Among Ages 16 to 19 years |
| Immigrants | Northern Africa | 69.0 /100 | #152 | Good 17.4% |
| Immigrants | Afghanistan | 68.6 /100 | #153 | Good 17.4% |
| Afghans | 68.1 /100 | #154 | Good 17.4% |
| Portuguese | 67.3 /100 | #155 | Good 17.4% |
| Costa Ricans | 65.9 /100 | #156 | Good 17.4% |
| Uruguayans | 64.3 /100 | #157 | Good 17.5% |
| Immigrants | China | 64.1 /100 | #158 | Good 17.5% |
| Koreans | 61.0 /100 | #159 | Good 17.5% |
| Ukrainians | 60.5 /100 | #160 | Good 17.5% |
| Immigrants | Denmark | 60.3 /100 | #161 | Good 17.5% |
| Immigrants | Norway | 59.8 /100 | #162 | Average 17.5% |
| Egyptians | 59.7 /100 | #163 | Average 17.5% |
| Immigrants | Austria | 57.7 /100 | #164 | Average 17.5% |
| Cape Verdeans | 55.8 /100 | #165 | Average 17.5% |
| Immigrants | Italy | 55.2 /100 | #166 | Average 17.5% |