Immigrants from Eastern Europe vs Immigrants from Western Africa Male Unemployment
COMPARE
Immigrants from Eastern Europe
Immigrants from Western Africa
Male Unemployment
Male Unemployment Comparison
Immigrants from Eastern Europe
Immigrants from Western Africa
5.3%
MALE UNEMPLOYMENT
54.1/ 100
METRIC RATING
170th/ 347
METRIC RANK
6.2%
MALE UNEMPLOYMENT
0.0/ 100
METRIC RATING
283rd/ 347
METRIC RANK
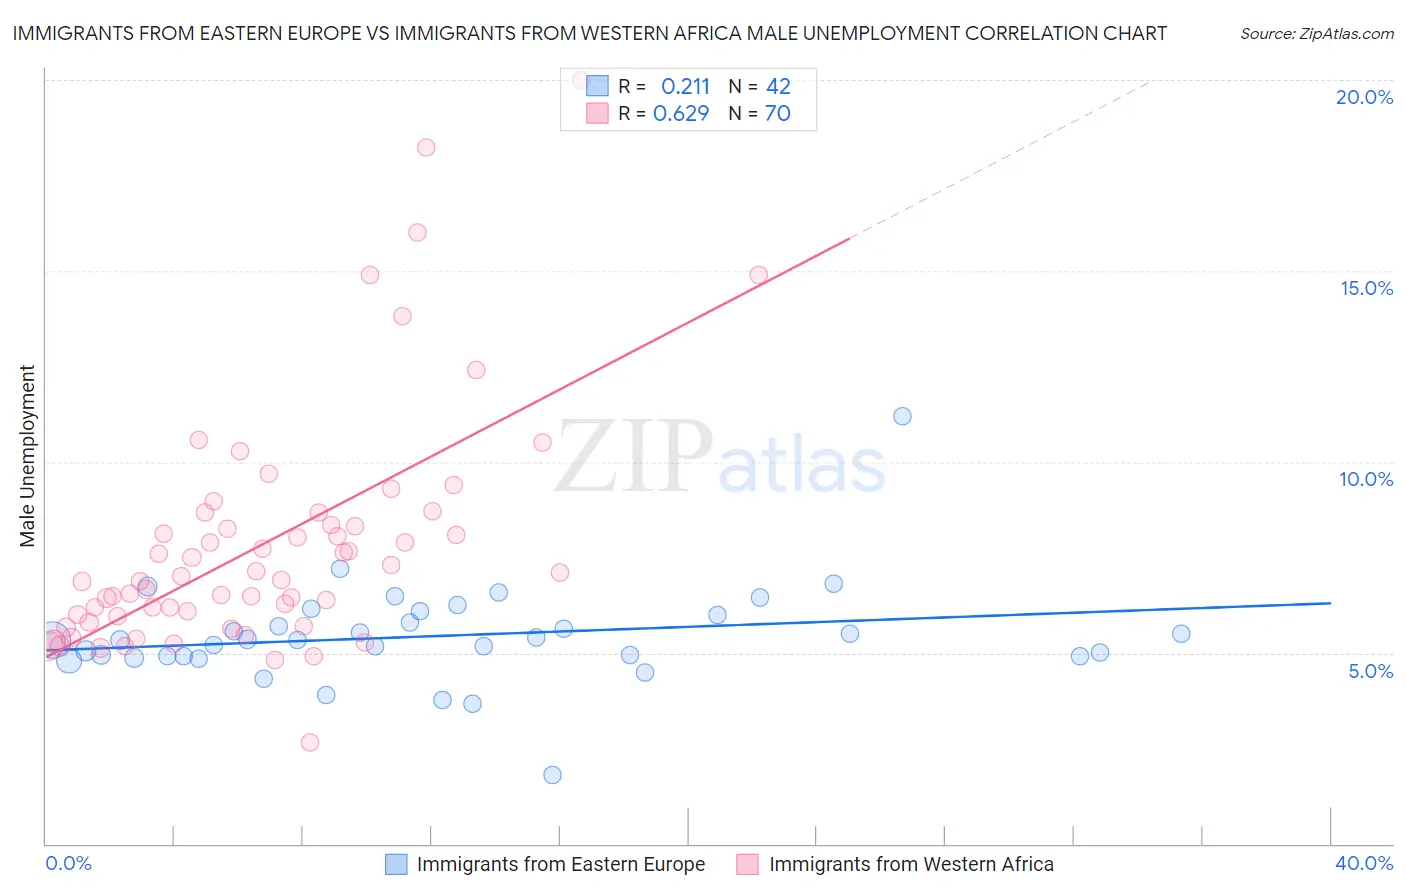
Immigrants from Eastern Europe vs Immigrants from Western Africa Male Unemployment Correlation Chart
The statistical analysis conducted on geographies consisting of 472,485,071 people shows a weak positive correlation between the proportion of Immigrants from Eastern Europe and unemployment rate among males in the United States with a correlation coefficient (R) of 0.211 and weighted average of 5.3%. Similarly, the statistical analysis conducted on geographies consisting of 356,888,506 people shows a significant positive correlation between the proportion of Immigrants from Western Africa and unemployment rate among males in the United States with a correlation coefficient (R) of 0.629 and weighted average of 6.2%, a difference of 17.1%.
Male Unemployment Correlation Summary
| Measurement | Immigrants from Eastern Europe | Immigrants from Western Africa |
| Minimum | 1.8% | 2.7% |
| Maximum | 11.2% | 20.0% |
| Range | 9.4% | 17.3% |
| Mean | 5.4% | 7.8% |
| Median | 5.3% | 7.0% |
| Interquartile 25% (IQ1) | 4.9% | 5.9% |
| Interquartile 75% (IQ3) | 6.0% | 8.3% |
| Interquartile Range (IQR) | 1.1% | 2.4% |
| Standard Deviation (Sample) | 1.3% | 3.1% |
| Standard Deviation (Population) | 1.3% | 3.1% |
Similar Demographics by Male Unemployment
Demographics Similar to Immigrants from Eastern Europe by Male Unemployment
In terms of male unemployment, the demographic groups most similar to Immigrants from Eastern Europe are Peruvian (5.3%, a difference of 0.13%), Immigrants from Kazakhstan (5.3%, a difference of 0.19%), Immigrants from Congo (5.3%, a difference of 0.20%), Immigrants from Russia (5.3%, a difference of 0.20%), and Immigrants from Ireland (5.3%, a difference of 0.22%).
| Demographics | Rating | Rank | Male Unemployment |
| Immigrants | Hong Kong | 65.7 /100 | #163 | Good 5.2% |
| Afghans | 62.0 /100 | #164 | Good 5.3% |
| South Americans | 60.6 /100 | #165 | Good 5.3% |
| Immigrants | Morocco | 60.2 /100 | #166 | Good 5.3% |
| Immigrants | Vietnam | 58.1 /100 | #167 | Average 5.3% |
| Immigrants | Ireland | 57.7 /100 | #168 | Average 5.3% |
| Immigrants | Congo | 57.4 /100 | #169 | Average 5.3% |
| Immigrants | Eastern Europe | 54.1 /100 | #170 | Average 5.3% |
| Peruvians | 51.9 /100 | #171 | Average 5.3% |
| Immigrants | Kazakhstan | 50.8 /100 | #172 | Average 5.3% |
| Immigrants | Russia | 50.7 /100 | #173 | Average 5.3% |
| Immigrants | Iran | 50.0 /100 | #174 | Average 5.3% |
| Immigrants | Iraq | 48.1 /100 | #175 | Average 5.3% |
| Immigrants | Poland | 46.0 /100 | #176 | Average 5.3% |
| Immigrants | Peru | 44.6 /100 | #177 | Average 5.3% |
Demographics Similar to Immigrants from Western Africa by Male Unemployment
In terms of male unemployment, the demographic groups most similar to Immigrants from Western Africa are Ecuadorian (6.2%, a difference of 0.030%), Sierra Leonean (6.2%, a difference of 0.46%), Immigrants from Ghana (6.2%, a difference of 0.53%), Spanish American Indian (6.2%, a difference of 0.65%), and Immigrants from Ecuador (6.2%, a difference of 0.67%).
| Demographics | Rating | Rank | Male Unemployment |
| Tlingit-Haida | 0.0 /100 | #276 | Tragic 6.0% |
| Immigrants | Liberia | 0.0 /100 | #277 | Tragic 6.1% |
| Immigrants | Fiji | 0.0 /100 | #278 | Tragic 6.1% |
| Ghanaians | 0.0 /100 | #279 | Tragic 6.1% |
| Immigrants | Ghana | 0.0 /100 | #280 | Tragic 6.2% |
| Sierra Leoneans | 0.0 /100 | #281 | Tragic 6.2% |
| Ecuadorians | 0.0 /100 | #282 | Tragic 6.2% |
| Immigrants | Western Africa | 0.0 /100 | #283 | Tragic 6.2% |
| Spanish American Indians | 0.0 /100 | #284 | Tragic 6.2% |
| Immigrants | Ecuador | 0.0 /100 | #285 | Tragic 6.2% |
| Africans | 0.0 /100 | #286 | Tragic 6.3% |
| Central American Indians | 0.0 /100 | #287 | Tragic 6.3% |
| Immigrants | Senegal | 0.0 /100 | #288 | Tragic 6.3% |
| Immigrants | Caribbean | 0.0 /100 | #289 | Tragic 6.3% |
| U.S. Virgin Islanders | 0.0 /100 | #290 | Tragic 6.4% |