Puerto Rican vs Immigrants from Middle Africa Unemployment Among Ages 20 to 24 years
COMPARE
Puerto Rican
Immigrants from Middle Africa
Unemployment Among Ages 20 to 24 years
Unemployment Among Ages 20 to 24 years Comparison
Puerto Ricans
Immigrants from Middle Africa
16.7%
UNEMPLOYMENT AMONG AGES 20 TO 24 YEARS
0.0/ 100
METRIC RATING
342nd/ 347
METRIC RANK
10.4%
UNEMPLOYMENT AMONG AGES 20 TO 24 YEARS
20.9/ 100
METRIC RATING
202nd/ 347
METRIC RANK
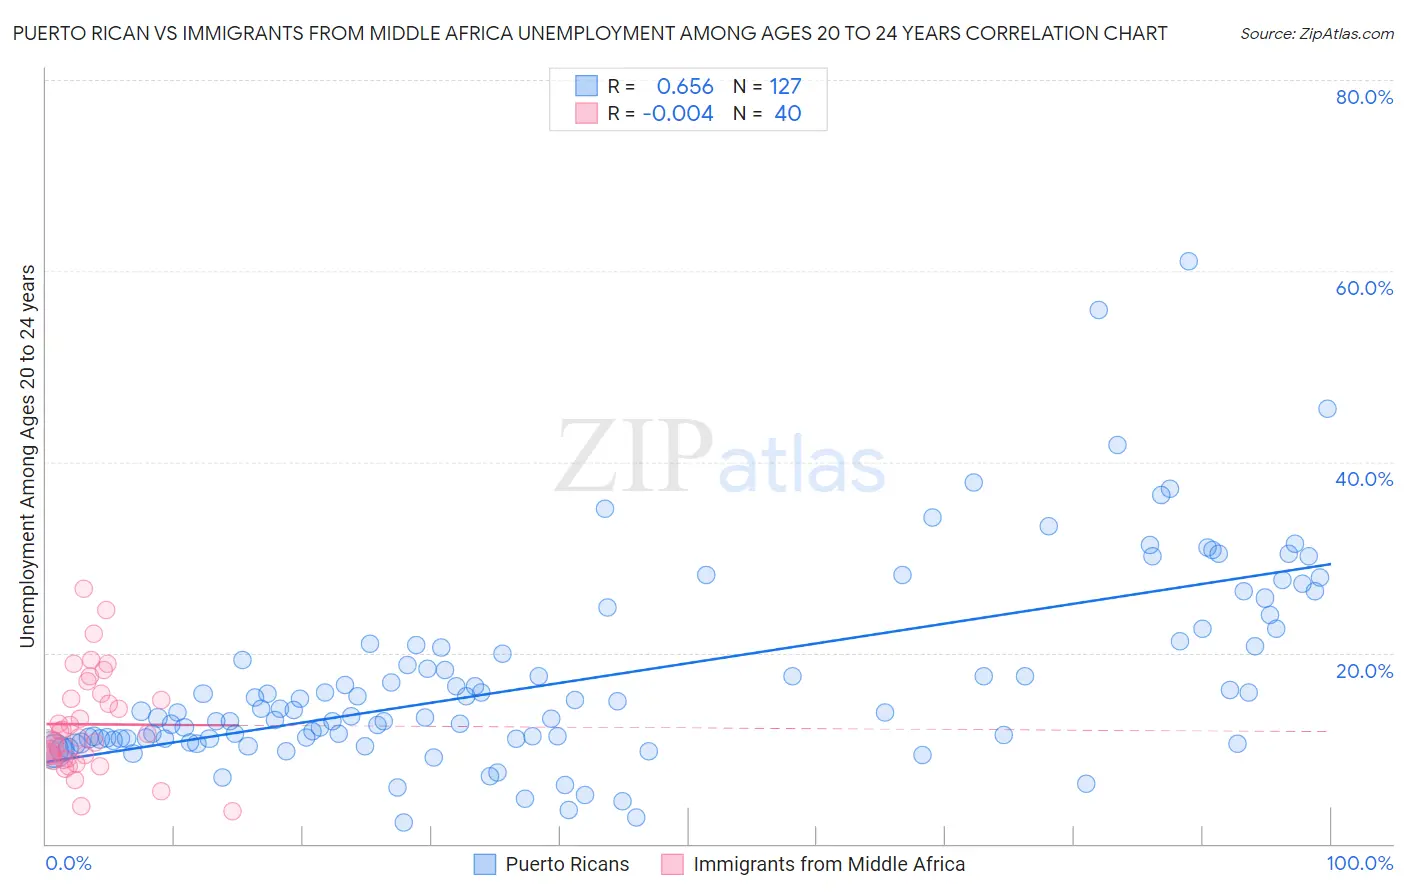
Puerto Rican vs Immigrants from Middle Africa Unemployment Among Ages 20 to 24 years Correlation Chart
The statistical analysis conducted on geographies consisting of 498,686,808 people shows a significant positive correlation between the proportion of Puerto Ricans and unemployment rate among population between the ages 20 and 24 in the United States with a correlation coefficient (R) of 0.656 and weighted average of 16.7%. Similarly, the statistical analysis conducted on geographies consisting of 200,508,228 people shows no correlation between the proportion of Immigrants from Middle Africa and unemployment rate among population between the ages 20 and 24 in the United States with a correlation coefficient (R) of -0.004 and weighted average of 10.4%, a difference of 59.6%.
Unemployment Among Ages 20 to 24 years Correlation Summary
| Measurement | Puerto Rican | Immigrants from Middle Africa |
| Minimum | 2.3% | 3.4% |
| Maximum | 61.0% | 26.7% |
| Range | 58.7% | 23.3% |
| Mean | 17.3% | 12.5% |
| Median | 13.9% | 11.3% |
| Interquartile 25% (IQ1) | 11.0% | 8.8% |
| Interquartile 75% (IQ3) | 21.0% | 15.5% |
| Interquartile Range (IQR) | 10.0% | 6.6% |
| Standard Deviation (Sample) | 10.2% | 5.3% |
| Standard Deviation (Population) | 10.1% | 5.2% |
Similar Demographics by Unemployment Among Ages 20 to 24 years
Demographics Similar to Puerto Ricans by Unemployment Among Ages 20 to 24 years
In terms of unemployment among ages 20 to 24 years, the demographic groups most similar to Puerto Ricans are Navajo (16.1%, a difference of 3.2%), Yuman (15.8%, a difference of 5.1%), Tsimshian (18.0%, a difference of 8.0%), Immigrants from Yemen (14.9%, a difference of 11.9%), and Crow (18.7%, a difference of 12.5%).
| Demographics | Rating | Rank | Unemployment Among Ages 20 to 24 years |
| Immigrants | Guyana | 0.0 /100 | #333 | Tragic 13.9% |
| Guyanese | 0.0 /100 | #334 | Tragic 14.0% |
| Sioux | 0.0 /100 | #335 | Tragic 14.2% |
| Pima | 0.0 /100 | #336 | Tragic 14.2% |
| Paiute | 0.0 /100 | #337 | Tragic 14.3% |
| Immigrants | St. Vincent and the Grenadines | 0.0 /100 | #338 | Tragic 14.3% |
| Immigrants | Yemen | 0.0 /100 | #339 | Tragic 14.9% |
| Yuman | 0.0 /100 | #340 | Tragic 15.8% |
| Navajo | 0.0 /100 | #341 | Tragic 16.1% |
| Puerto Ricans | 0.0 /100 | #342 | Tragic 16.7% |
| Tsimshian | 0.0 /100 | #343 | Tragic 18.0% |
| Crow | 0.0 /100 | #344 | Tragic 18.7% |
| Hopi | 0.0 /100 | #345 | Tragic 19.9% |
| Yup'ik | 0.0 /100 | #346 | Tragic 20.9% |
| Inupiat | 0.0 /100 | #347 | Tragic 20.9% |
Demographics Similar to Immigrants from Middle Africa by Unemployment Among Ages 20 to 24 years
In terms of unemployment among ages 20 to 24 years, the demographic groups most similar to Immigrants from Middle Africa are Russian (10.4%, a difference of 0.020%), Immigrants from Peru (10.4%, a difference of 0.020%), South American (10.4%, a difference of 0.020%), Portuguese (10.4%, a difference of 0.050%), and Colombian (10.4%, a difference of 0.080%).
| Demographics | Rating | Rank | Unemployment Among Ages 20 to 24 years |
| Egyptians | 24.5 /100 | #195 | Fair 10.4% |
| Immigrants | Philippines | 24.1 /100 | #196 | Fair 10.4% |
| Immigrants | Denmark | 22.8 /100 | #197 | Fair 10.4% |
| Colombians | 22.3 /100 | #198 | Fair 10.4% |
| Portuguese | 21.8 /100 | #199 | Fair 10.4% |
| Russians | 21.2 /100 | #200 | Fair 10.4% |
| Immigrants | Peru | 21.2 /100 | #201 | Fair 10.4% |
| Immigrants | Middle Africa | 20.9 /100 | #202 | Fair 10.4% |
| South Americans | 20.6 /100 | #203 | Fair 10.4% |
| Immigrants | Northern Europe | 19.5 /100 | #204 | Poor 10.4% |
| Cypriots | 18.9 /100 | #205 | Poor 10.4% |
| Immigrants | Europe | 18.5 /100 | #206 | Poor 10.4% |
| Immigrants | Honduras | 17.9 /100 | #207 | Poor 10.4% |
| Immigrants | Hong Kong | 17.6 /100 | #208 | Poor 10.5% |
| Peruvians | 17.2 /100 | #209 | Poor 10.5% |