British vs Menominee Unemployment Among Ages 20 to 24 years
COMPARE
British
Menominee
Unemployment Among Ages 20 to 24 years
Unemployment Among Ages 20 to 24 years Comparison
British
Menominee
9.8%
UNEMPLOYMENT AMONG AGES 20 TO 24 YEARS
99.4/ 100
METRIC RATING
63rd/ 347
METRIC RANK
9.7%
UNEMPLOYMENT AMONG AGES 20 TO 24 YEARS
99.8/ 100
METRIC RATING
43rd/ 347
METRIC RANK
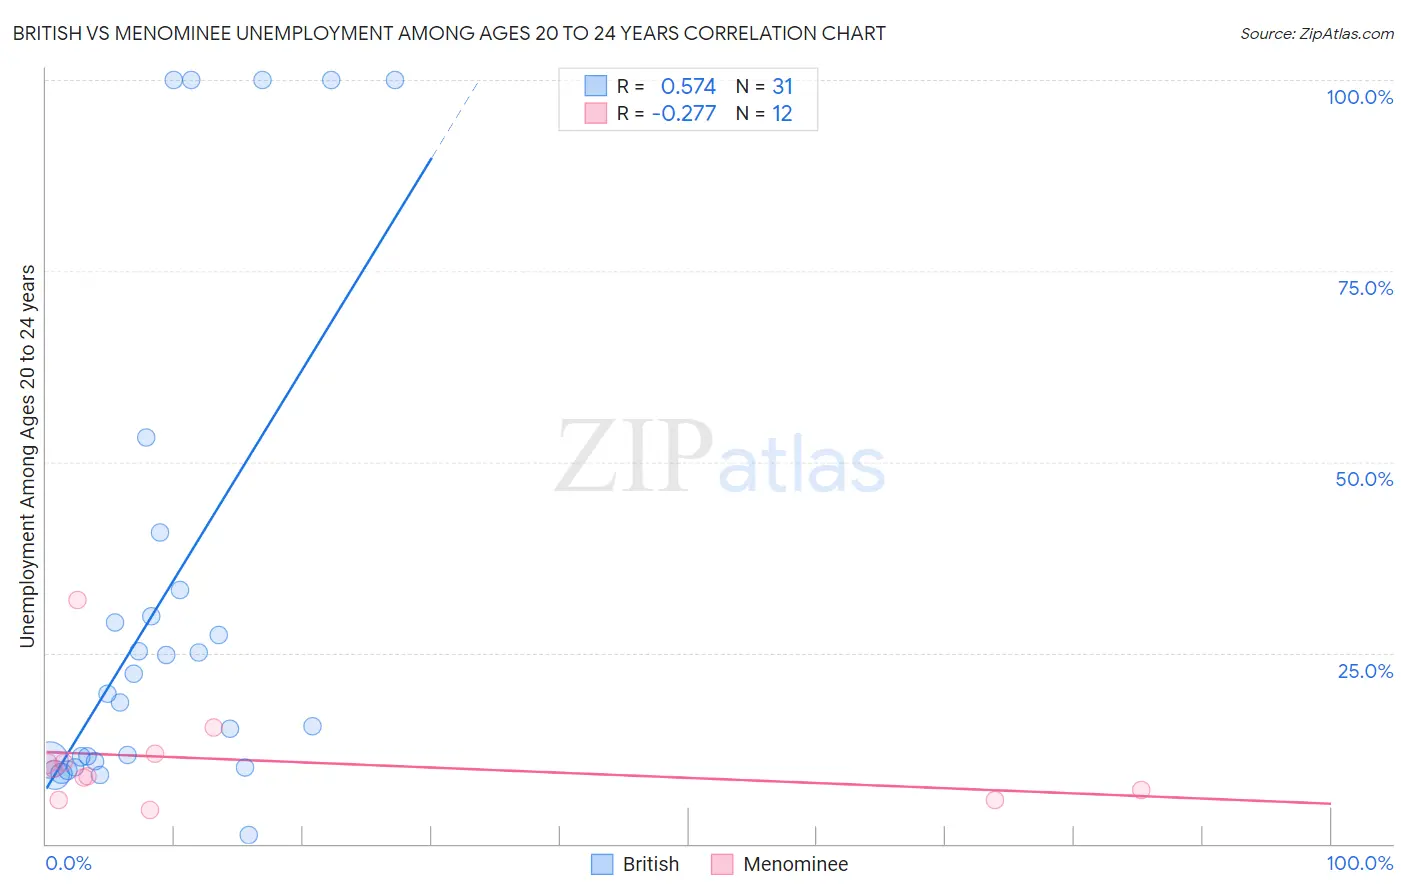
British vs Menominee Unemployment Among Ages 20 to 24 years Correlation Chart
The statistical analysis conducted on geographies consisting of 495,891,329 people shows a substantial positive correlation between the proportion of British and unemployment rate among population between the ages 20 and 24 in the United States with a correlation coefficient (R) of 0.574 and weighted average of 9.8%. Similarly, the statistical analysis conducted on geographies consisting of 45,217,479 people shows a weak negative correlation between the proportion of Menominee and unemployment rate among population between the ages 20 and 24 in the United States with a correlation coefficient (R) of -0.277 and weighted average of 9.7%, a difference of 1.4%.
Unemployment Among Ages 20 to 24 years Correlation Summary
| Measurement | British | Menominee |
| Minimum | 1.1% | 4.5% |
| Maximum | 100.0% | 32.0% |
| Range | 98.9% | 27.5% |
| Mean | 32.0% | 10.9% |
| Median | 19.6% | 9.3% |
| Interquartile 25% (IQ1) | 10.9% | 6.4% |
| Interquartile 75% (IQ3) | 33.3% | 11.3% |
| Interquartile Range (IQR) | 22.4% | 4.8% |
| Standard Deviation (Sample) | 32.1% | 7.3% |
| Standard Deviation (Population) | 31.6% | 7.0% |
Demographics Similar to British and Menominee by Unemployment Among Ages 20 to 24 years
In terms of unemployment among ages 20 to 24 years, the demographic groups most similar to British are Immigrants from Singapore (9.8%, a difference of 0.010%), Malaysian (9.8%, a difference of 0.11%), Immigrants from Kuwait (9.8%, a difference of 0.13%), Pakistani (9.8%, a difference of 0.16%), and English (9.8%, a difference of 0.16%). Similarly, the demographic groups most similar to Menominee are European (9.7%, a difference of 0.13%), Croatian (9.7%, a difference of 0.19%), Immigrants from Nicaragua (9.7%, a difference of 0.20%), Immigrants from India (9.7%, a difference of 0.32%), and Finnish (9.7%, a difference of 0.33%).
| Demographics | Rating | Rank | Unemployment Among Ages 20 to 24 years |
| Menominee | 99.8 /100 | #43 | Exceptional 9.7% |
| Europeans | 99.8 /100 | #44 | Exceptional 9.7% |
| Croatians | 99.8 /100 | #45 | Exceptional 9.7% |
| Immigrants | Nicaragua | 99.8 /100 | #46 | Exceptional 9.7% |
| Immigrants | India | 99.8 /100 | #47 | Exceptional 9.7% |
| Finns | 99.8 /100 | #48 | Exceptional 9.7% |
| Creek | 99.8 /100 | #49 | Exceptional 9.7% |
| Immigrants | Kenya | 99.7 /100 | #50 | Exceptional 9.7% |
| Ethiopians | 99.7 /100 | #51 | Exceptional 9.8% |
| Immigrants | Thailand | 99.7 /100 | #52 | Exceptional 9.8% |
| Immigrants | Serbia | 99.6 /100 | #53 | Exceptional 9.8% |
| Immigrants | Cambodia | 99.6 /100 | #54 | Exceptional 9.8% |
| Carpatho Rusyns | 99.6 /100 | #55 | Exceptional 9.8% |
| Nicaraguans | 99.6 /100 | #56 | Exceptional 9.8% |
| Immigrants | Moldova | 99.5 /100 | #57 | Exceptional 9.8% |
| Pakistanis | 99.5 /100 | #58 | Exceptional 9.8% |
| English | 99.5 /100 | #59 | Exceptional 9.8% |
| Immigrants | Kuwait | 99.5 /100 | #60 | Exceptional 9.8% |
| Malaysians | 99.5 /100 | #61 | Exceptional 9.8% |
| Immigrants | Singapore | 99.4 /100 | #62 | Exceptional 9.8% |
| British | 99.4 /100 | #63 | Exceptional 9.8% |