Brazilian vs Immigrants from Germany Unemployment Among Ages 20 to 24 years
COMPARE
Brazilian
Immigrants from Germany
Unemployment Among Ages 20 to 24 years
Unemployment Among Ages 20 to 24 years Comparison
Brazilians
Immigrants from Germany
10.2%
UNEMPLOYMENT AMONG AGES 20 TO 24 YEARS
78.4/ 100
METRIC RATING
144th/ 347
METRIC RANK
10.4%
UNEMPLOYMENT AMONG AGES 20 TO 24 YEARS
38.1/ 100
METRIC RATING
182nd/ 347
METRIC RANK
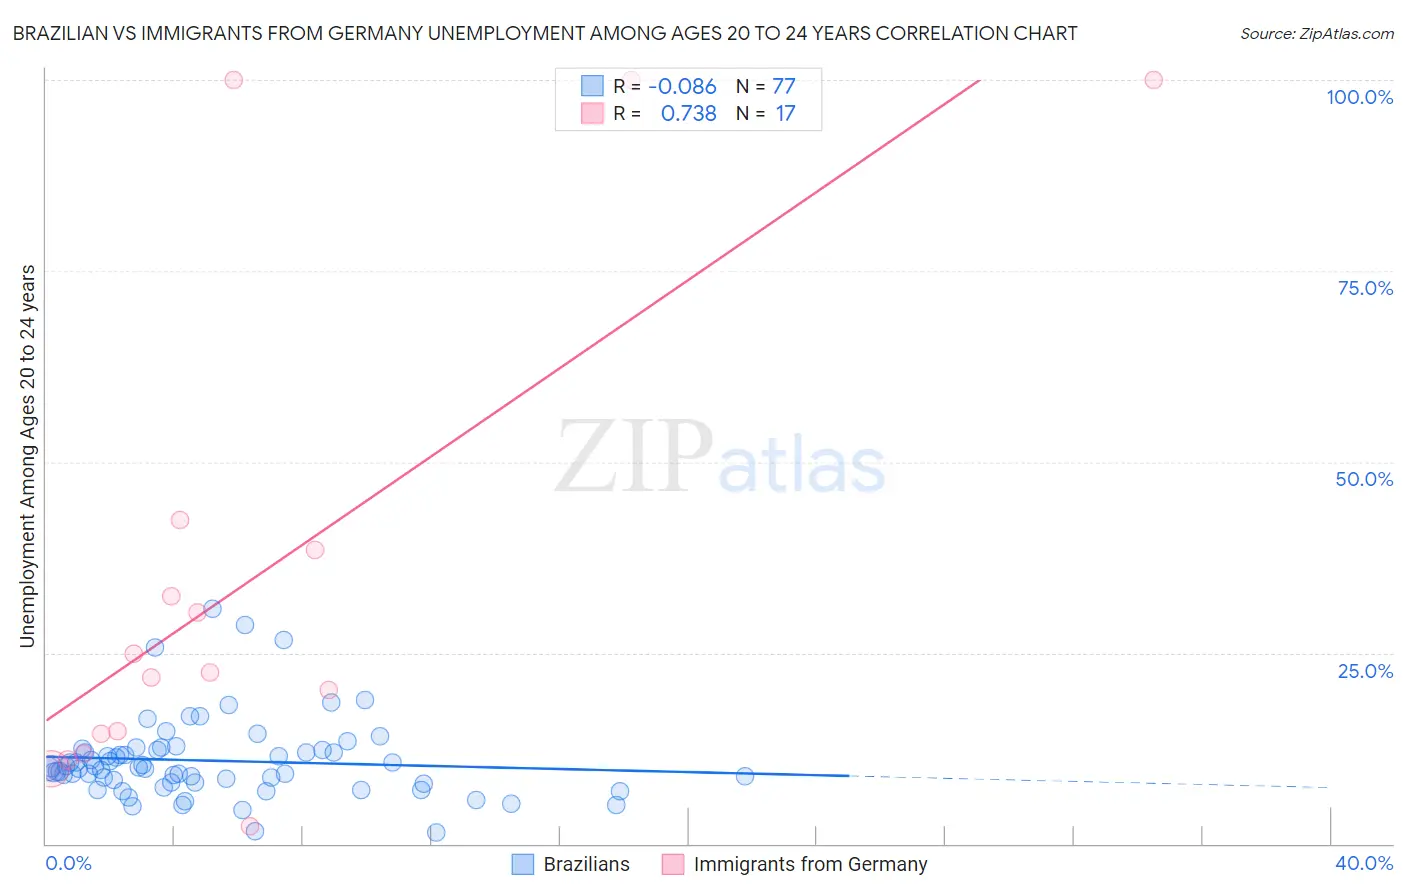
Brazilian vs Immigrants from Germany Unemployment Among Ages 20 to 24 years Correlation Chart
The statistical analysis conducted on geographies consisting of 317,079,134 people shows a slight negative correlation between the proportion of Brazilians and unemployment rate among population between the ages 20 and 24 in the United States with a correlation coefficient (R) of -0.086 and weighted average of 10.2%. Similarly, the statistical analysis conducted on geographies consisting of 442,881,118 people shows a strong positive correlation between the proportion of Immigrants from Germany and unemployment rate among population between the ages 20 and 24 in the United States with a correlation coefficient (R) of 0.738 and weighted average of 10.4%, a difference of 1.6%.
Unemployment Among Ages 20 to 24 years Correlation Summary
| Measurement | Brazilian | Immigrants from Germany |
| Minimum | 1.4% | 2.3% |
| Maximum | 30.8% | 100.0% |
| Range | 29.4% | 97.7% |
| Mean | 10.9% | 35.1% |
| Median | 9.9% | 22.4% |
| Interquartile 25% (IQ1) | 8.1% | 13.1% |
| Interquartile 75% (IQ3) | 12.2% | 40.4% |
| Interquartile Range (IQR) | 4.1% | 27.3% |
| Standard Deviation (Sample) | 5.3% | 32.7% |
| Standard Deviation (Population) | 5.3% | 31.7% |
Similar Demographics by Unemployment Among Ages 20 to 24 years
Demographics Similar to Brazilians by Unemployment Among Ages 20 to 24 years
In terms of unemployment among ages 20 to 24 years, the demographic groups most similar to Brazilians are Argentinean (10.2%, a difference of 0.020%), Immigrants from Jordan (10.2%, a difference of 0.040%), Asian (10.2%, a difference of 0.040%), French Canadian (10.2%, a difference of 0.040%), and Slovak (10.2%, a difference of 0.11%).
| Demographics | Rating | Rank | Unemployment Among Ages 20 to 24 years |
| Immigrants | North America | 82.5 /100 | #137 | Excellent 10.2% |
| Burmese | 82.3 /100 | #138 | Excellent 10.2% |
| Uruguayans | 81.9 /100 | #139 | Excellent 10.2% |
| Immigrants | Austria | 81.4 /100 | #140 | Excellent 10.2% |
| Immigrants | Azores | 81.4 /100 | #141 | Excellent 10.2% |
| Slovaks | 80.2 /100 | #142 | Excellent 10.2% |
| Immigrants | Jordan | 79.0 /100 | #143 | Good 10.2% |
| Brazilians | 78.4 /100 | #144 | Good 10.2% |
| Argentineans | 78.0 /100 | #145 | Good 10.2% |
| Asians | 77.7 /100 | #146 | Good 10.2% |
| French Canadians | 77.5 /100 | #147 | Good 10.2% |
| Immigrants | Romania | 75.7 /100 | #148 | Good 10.2% |
| Immigrants | Scotland | 74.6 /100 | #149 | Good 10.2% |
| Hungarians | 74.4 /100 | #150 | Good 10.2% |
| Immigrants | South Africa | 73.6 /100 | #151 | Good 10.2% |
Demographics Similar to Immigrants from Germany by Unemployment Among Ages 20 to 24 years
In terms of unemployment among ages 20 to 24 years, the demographic groups most similar to Immigrants from Germany are Immigrants from Egypt (10.4%, a difference of 0.030%), Okinawan (10.3%, a difference of 0.040%), Greek (10.4%, a difference of 0.040%), Immigrants from Turkey (10.3%, a difference of 0.050%), and Tlingit-Haida (10.3%, a difference of 0.060%).
| Demographics | Rating | Rank | Unemployment Among Ages 20 to 24 years |
| Samoans | 45.4 /100 | #175 | Average 10.3% |
| Potawatomi | 42.0 /100 | #176 | Average 10.3% |
| Immigrants | Czechoslovakia | 40.8 /100 | #177 | Average 10.3% |
| Alsatians | 40.5 /100 | #178 | Average 10.3% |
| Tlingit-Haida | 39.7 /100 | #179 | Fair 10.3% |
| Immigrants | Turkey | 39.3 /100 | #180 | Fair 10.3% |
| Okinawans | 39.1 /100 | #181 | Fair 10.3% |
| Immigrants | Germany | 38.1 /100 | #182 | Fair 10.4% |
| Immigrants | Egypt | 37.4 /100 | #183 | Fair 10.4% |
| Greeks | 37.2 /100 | #184 | Fair 10.4% |
| Syrians | 35.6 /100 | #185 | Fair 10.4% |
| Guamanians/Chamorros | 35.4 /100 | #186 | Fair 10.4% |
| Immigrants | Western Europe | 35.0 /100 | #187 | Fair 10.4% |
| Immigrants | Russia | 34.6 /100 | #188 | Fair 10.4% |
| Hawaiians | 33.9 /100 | #189 | Fair 10.4% |