Brazilian vs Inupiat Unemployment Among Youth under 25 years
COMPARE
Brazilian
Inupiat
Unemployment Among Youth under 25 years
Unemployment Among Youth under 25 years Comparison
Brazilians
Inupiat
11.5%
UNEMPLOYMENT AMONG YOUTH UNDER 25 YEARS
72.5/ 100
METRIC RATING
146th/ 347
METRIC RANK
22.0%
UNEMPLOYMENT AMONG YOUTH UNDER 25 YEARS
0.0/ 100
METRIC RATING
346th/ 347
METRIC RANK
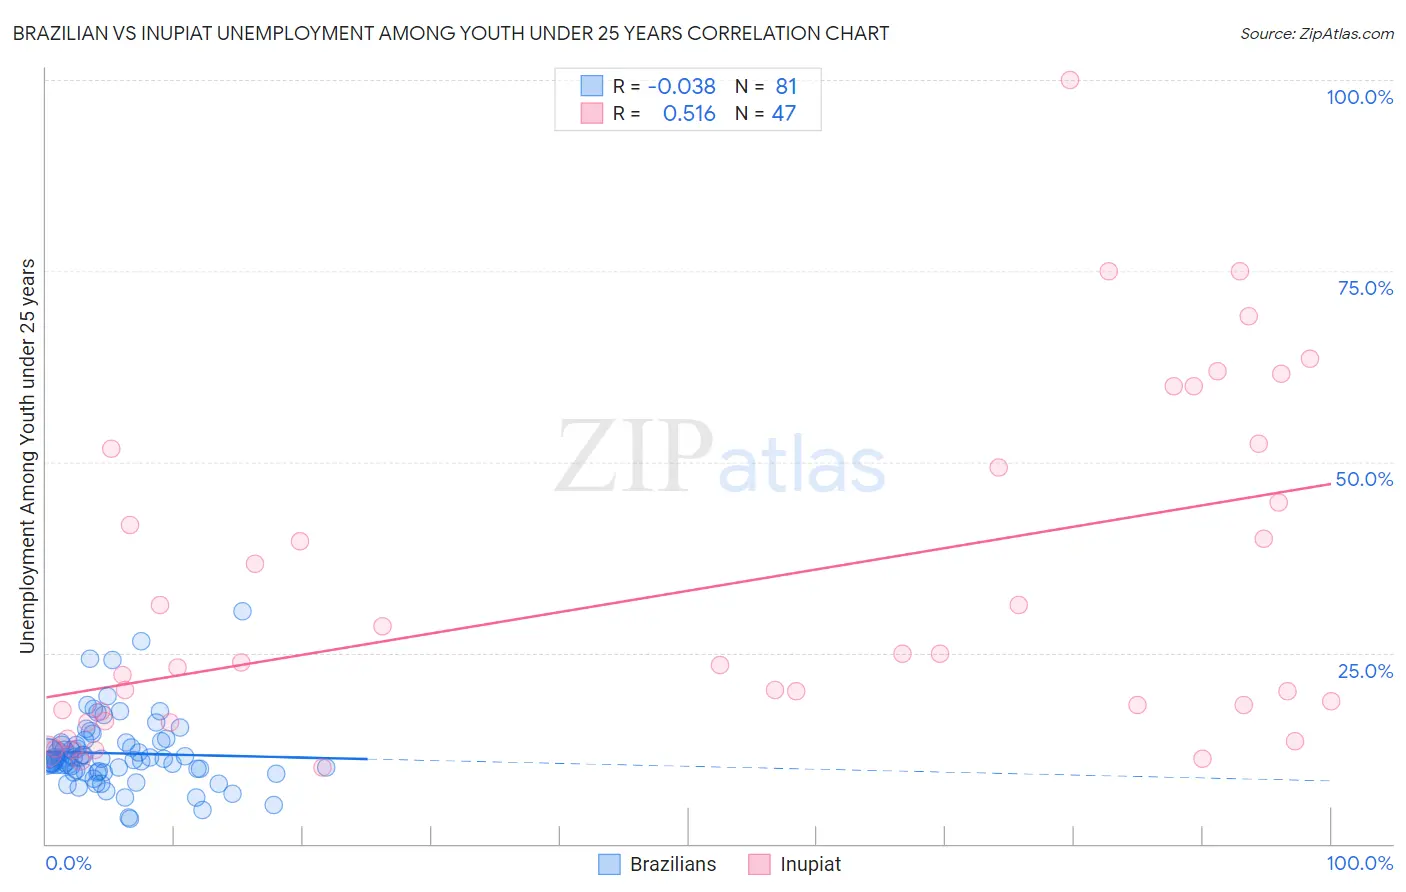
Brazilian vs Inupiat Unemployment Among Youth under 25 years Correlation Chart
The statistical analysis conducted on geographies consisting of 321,254,906 people shows no correlation between the proportion of Brazilians and unemployment rate among youth under the age of 25 in the United States with a correlation coefficient (R) of -0.038 and weighted average of 11.5%. Similarly, the statistical analysis conducted on geographies consisting of 95,982,795 people shows a substantial positive correlation between the proportion of Inupiat and unemployment rate among youth under the age of 25 in the United States with a correlation coefficient (R) of 0.516 and weighted average of 22.0%, a difference of 91.4%.
Unemployment Among Youth under 25 years Correlation Summary
| Measurement | Brazilian | Inupiat |
| Minimum | 3.2% | 10.0% |
| Maximum | 30.5% | 100.0% |
| Range | 27.3% | 90.0% |
| Mean | 11.8% | 32.8% |
| Median | 11.1% | 23.4% |
| Interquartile 25% (IQ1) | 9.5% | 16.0% |
| Interquartile 75% (IQ3) | 13.3% | 49.3% |
| Interquartile Range (IQR) | 3.8% | 33.3% |
| Standard Deviation (Sample) | 4.7% | 21.8% |
| Standard Deviation (Population) | 4.6% | 21.6% |
Similar Demographics by Unemployment Among Youth under 25 years
Demographics Similar to Brazilians by Unemployment Among Youth under 25 years
In terms of unemployment among youth under 25 years, the demographic groups most similar to Brazilians are Laotian (11.5%, a difference of 0.0%), Argentinean (11.5%, a difference of 0.020%), Immigrants from Northern Europe (11.5%, a difference of 0.020%), Immigrants from Cambodia (11.5%, a difference of 0.040%), and Immigrants from Switzerland (11.5%, a difference of 0.050%).
| Demographics | Rating | Rank | Unemployment Among Youth under 25 years |
| Immigrants | Indonesia | 77.6 /100 | #139 | Good 11.5% |
| Immigrants | Belgium | 77.5 /100 | #140 | Good 11.5% |
| Immigrants | Uruguay | 76.1 /100 | #141 | Good 11.5% |
| Immigrants | Korea | 75.1 /100 | #142 | Good 11.5% |
| Immigrants | Uganda | 74.5 /100 | #143 | Good 11.5% |
| Immigrants | Brazil | 74.3 /100 | #144 | Good 11.5% |
| Argentineans | 73.0 /100 | #145 | Good 11.5% |
| Brazilians | 72.5 /100 | #146 | Good 11.5% |
| Laotians | 72.4 /100 | #147 | Good 11.5% |
| Immigrants | Northern Europe | 72.1 /100 | #148 | Good 11.5% |
| Immigrants | Cambodia | 71.8 /100 | #149 | Good 11.5% |
| Immigrants | Switzerland | 71.6 /100 | #150 | Good 11.5% |
| Uruguayans | 70.4 /100 | #151 | Good 11.5% |
| Iraqis | 68.3 /100 | #152 | Good 11.5% |
| Immigrants | Czechoslovakia | 67.1 /100 | #153 | Good 11.5% |
Demographics Similar to Inupiat by Unemployment Among Youth under 25 years
In terms of unemployment among youth under 25 years, the demographic groups most similar to Inupiat are Hopi (21.5%, a difference of 2.5%), Yup'ik (23.7%, a difference of 8.0%), Crow (20.1%, a difference of 9.6%), Navajo (18.6%, a difference of 18.1%), and Puerto Rican (18.4%, a difference of 19.5%).
| Demographics | Rating | Rank | Unemployment Among Youth under 25 years |
| Guyanese | 0.0 /100 | #333 | Tragic 15.9% |
| Immigrants | Guyana | 0.0 /100 | #334 | Tragic 15.9% |
| Immigrants | St. Vincent and the Grenadines | 0.0 /100 | #335 | Tragic 16.1% |
| Pima | 0.0 /100 | #336 | Tragic 16.2% |
| Arapaho | 0.0 /100 | #337 | Tragic 16.3% |
| Yuman | 0.0 /100 | #338 | Tragic 16.3% |
| Tsimshian | 0.0 /100 | #339 | Tragic 16.5% |
| Colville | 0.0 /100 | #340 | Tragic 16.8% |
| Paiute | 0.0 /100 | #341 | Tragic 17.6% |
| Puerto Ricans | 0.0 /100 | #342 | Tragic 18.4% |
| Navajo | 0.0 /100 | #343 | Tragic 18.6% |
| Crow | 0.0 /100 | #344 | Tragic 20.1% |
| Hopi | 0.0 /100 | #345 | Tragic 21.5% |
| Inupiat | 0.0 /100 | #346 | Tragic 22.0% |
| Yup'ik | 0.0 /100 | #347 | Tragic 23.7% |