Bolivian vs Immigrants from North America Female Unemployment
COMPARE
Bolivian
Immigrants from North America
Female Unemployment
Female Unemployment Comparison
Bolivians
Immigrants from North America
5.0%
FEMALE UNEMPLOYMENT
97.1/ 100
METRIC RATING
86th/ 347
METRIC RANK
4.9%
FEMALE UNEMPLOYMENT
98.3/ 100
METRIC RATING
65th/ 347
METRIC RANK
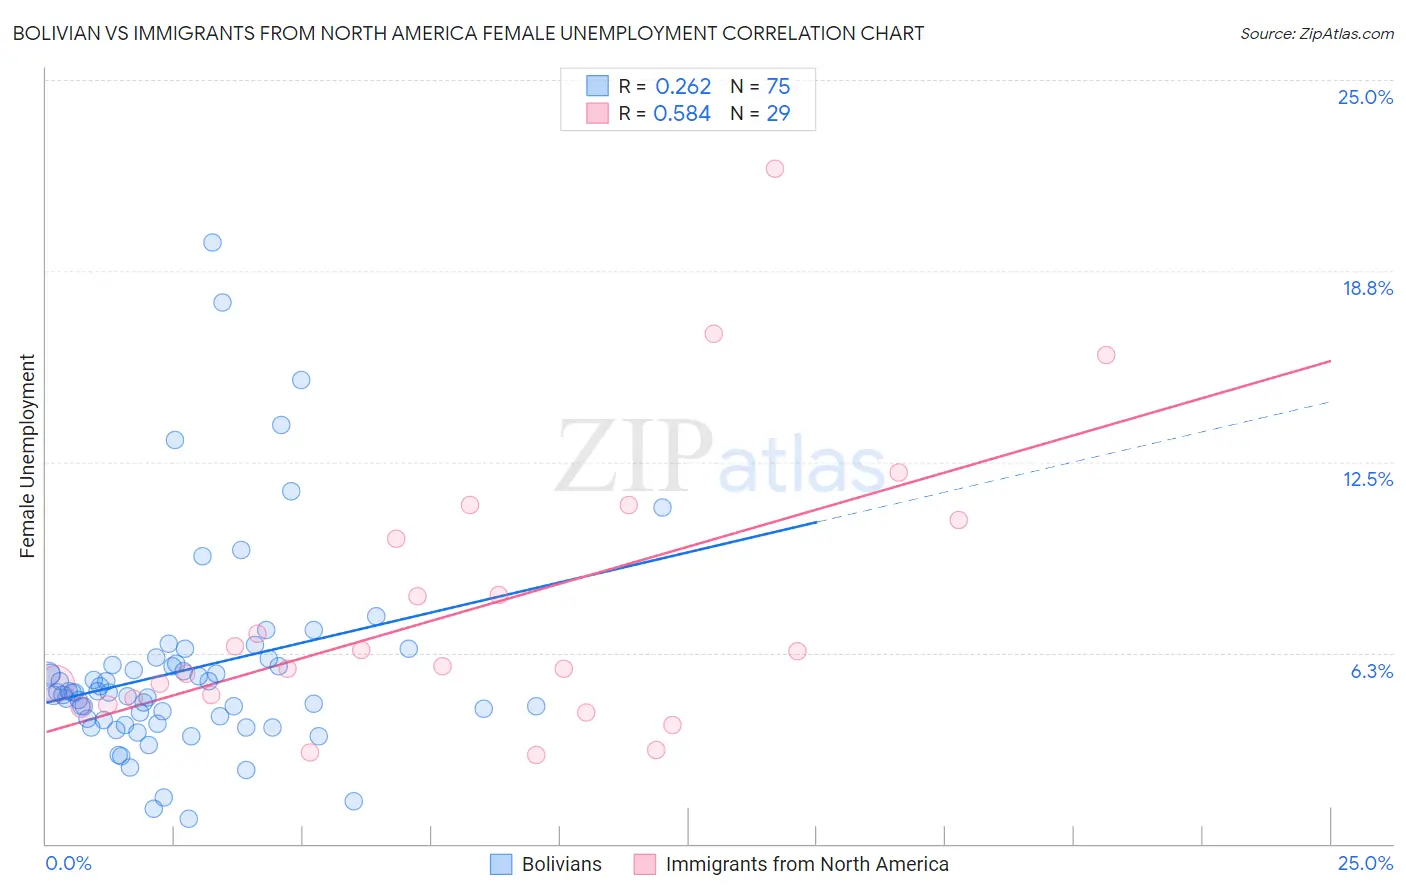
Bolivian vs Immigrants from North America Female Unemployment Correlation Chart
The statistical analysis conducted on geographies consisting of 184,486,033 people shows a weak positive correlation between the proportion of Bolivians and unemploymnet rate among females in the United States with a correlation coefficient (R) of 0.262 and weighted average of 5.0%. Similarly, the statistical analysis conducted on geographies consisting of 458,145,875 people shows a substantial positive correlation between the proportion of Immigrants from North America and unemploymnet rate among females in the United States with a correlation coefficient (R) of 0.584 and weighted average of 4.9%, a difference of 0.89%.
Female Unemployment Correlation Summary
| Measurement | Bolivian | Immigrants from North America |
| Minimum | 0.80% | 2.9% |
| Maximum | 19.7% | 22.1% |
| Range | 18.9% | 19.2% |
| Mean | 5.7% | 7.6% |
| Median | 4.9% | 5.8% |
| Interquartile 25% (IQ1) | 4.1% | 4.6% |
| Interquartile 75% (IQ3) | 5.9% | 10.3% |
| Interquartile Range (IQR) | 1.8% | 5.7% |
| Standard Deviation (Sample) | 3.4% | 4.5% |
| Standard Deviation (Population) | 3.3% | 4.5% |
Similar Demographics by Female Unemployment
Demographics Similar to Bolivians by Female Unemployment
In terms of female unemployment, the demographic groups most similar to Bolivians are Ukrainian (5.0%, a difference of 0.010%), Canadian (5.0%, a difference of 0.050%), Immigrants from Serbia (5.0%, a difference of 0.090%), Venezuelan (5.0%, a difference of 0.090%), and Immigrants from Australia (5.0%, a difference of 0.11%).
| Demographics | Rating | Rank | Female Unemployment |
| Turks | 97.6 /100 | #79 | Exceptional 5.0% |
| New Zealanders | 97.4 /100 | #80 | Exceptional 5.0% |
| Filipinos | 97.3 /100 | #81 | Exceptional 5.0% |
| Immigrants | Australia | 97.3 /100 | #82 | Exceptional 5.0% |
| Immigrants | Serbia | 97.2 /100 | #83 | Exceptional 5.0% |
| Canadians | 97.2 /100 | #84 | Exceptional 5.0% |
| Ukrainians | 97.1 /100 | #85 | Exceptional 5.0% |
| Bolivians | 97.1 /100 | #86 | Exceptional 5.0% |
| Venezuelans | 96.9 /100 | #87 | Exceptional 5.0% |
| Immigrants | Sudan | 96.7 /100 | #88 | Exceptional 5.0% |
| Immigrants | Taiwan | 96.6 /100 | #89 | Exceptional 5.0% |
| Immigrants | Sweden | 96.3 /100 | #90 | Exceptional 5.0% |
| Immigrants | Japan | 96.0 /100 | #91 | Exceptional 5.0% |
| Romanians | 95.9 /100 | #92 | Exceptional 5.0% |
| Immigrants | Austria | 95.7 /100 | #93 | Exceptional 5.0% |
Demographics Similar to Immigrants from North America by Female Unemployment
In terms of female unemployment, the demographic groups most similar to Immigrants from North America are Hungarian (4.9%, a difference of 0.030%), Cuban (4.9%, a difference of 0.030%), Tlingit-Haida (4.9%, a difference of 0.040%), Immigrants from Ireland (4.9%, a difference of 0.050%), and Osage (4.9%, a difference of 0.090%).
| Demographics | Rating | Rank | Female Unemployment |
| Immigrants | Lithuania | 98.8 /100 | #58 | Exceptional 4.9% |
| Bhutanese | 98.7 /100 | #59 | Exceptional 4.9% |
| Immigrants | Scotland | 98.6 /100 | #60 | Exceptional 4.9% |
| Immigrants | Canada | 98.6 /100 | #61 | Exceptional 4.9% |
| Immigrants | Nepal | 98.6 /100 | #62 | Exceptional 4.9% |
| Immigrants | Belgium | 98.5 /100 | #63 | Exceptional 4.9% |
| Celtics | 98.5 /100 | #64 | Exceptional 4.9% |
| Immigrants | North America | 98.3 /100 | #65 | Exceptional 4.9% |
| Hungarians | 98.3 /100 | #66 | Exceptional 4.9% |
| Cubans | 98.3 /100 | #67 | Exceptional 4.9% |
| Tlingit-Haida | 98.3 /100 | #68 | Exceptional 4.9% |
| Immigrants | Ireland | 98.2 /100 | #69 | Exceptional 4.9% |
| Osage | 98.2 /100 | #70 | Exceptional 4.9% |
| German Russians | 98.1 /100 | #71 | Exceptional 4.9% |
| Immigrants | Northern Europe | 98.0 /100 | #72 | Exceptional 4.9% |