Immigrants from Scotland vs Portuguese Unemployment Among Ages 65 to 74 years

COMPARE

Immigrants from Scotland
Race
Ancestry
AfghanAfricanAlaska NativeAlaskan AthabascanAlbanianAleutAlsatianAmericanApacheArabArapahoArgentineanArmenianAssyrian/Chaldean/SyriacAustralianAustrianBahamianBangladeshiBarbadianBasqueBelgianBelizeanBermudanBhutaneseBlackfeetBolivianBrazilianBritishBritish West IndianBulgarianBurmeseCajunCambodianCanadianCape VerdeanCarpatho RusynCelticCentral AmericanCentral American IndianCherokeeCheyenneChickasawChileanChineseChippewaChoctawColombianColvilleComancheCosta RicanCreeCreekCroatianCrowCubanCypriotCzechCzechoslovakianDanishDelawareDominicanDutchDutch West IndianEastern EuropeanEcuadorianEgyptianEnglishEstonianEthiopianEuropeanFijianFilipinoFinnishFrenchFrench American IndianFrench CanadianGermanGerman RussianGhanaianGreekGuamanian/ChamorroGuatemalanGuyaneseHaitianHmongHonduranHopiHoumaHungarianIcelanderIndian (Asian)IndonesianInupiatIranianIraqiIrishIroquoisIsraeliItalianJamaicanJapaneseJordanianKenyanKiowaKoreanLaotianLatvianLebaneseLiberianLithuanianLumbeeLuxembourgerMacedonianMalaysianMalteseMarshalleseMenomineeMexicanMexican American IndianMongolianMoroccanNative HawaiianNavajoNepaleseNew ZealanderNicaraguanNigerianNorthern EuropeanNorwegianOkinawanOsageOttawaPaiutePakistaniPalestinianPanamanianParaguayanPennsylvania GermanPeruvianPimaPolishPotawatomiPuebloPuerto RicanPuget Sound SalishRomanianRussianSalvadoranSamoanScandinavianScotch-IrishScottishSeminoleSenegaleseSerbianShoshoneSierra LeoneanSiouxSlavicSlovakSloveneSomaliSouth AfricanSouth AmericanSouth American IndianSoviet UnionSpaniardSpanishSpanish AmericanSpanish American IndianSri LankanSubsaharan AfricanSudaneseSwedishSwissSyrianTaiwaneseThaiTlingit-HaidaTohono O'OdhamTonganTrinidadian and TobagonianTsimshianTurkishU.S. Virgin IslanderUgandanUkrainianUruguayanUteVenezuelanVietnameseWelshWest IndianYakamaYaquiYugoslavianYumanYup'ikZimbabwean
Immigration
NonimmigrantsImmigrantsAfghanistanAfricaAlbaniaArgentinaArmeniaAsiaAustraliaAustriaBahamasBangladeshBarbadosBelarusBelgiumBelizeBoliviaBosnia and HerzegovinaBrazilBulgariaBurma/MyanmarCabo VerdeCambodiaCameroonCanadaCaribbeanCentral AmericaChileChinaColombiaCongoCosta RicaCroatiaCubaCzechoslovakiaDenmarkDominicaDominican RepublicEastern AfricaEastern AsiaEastern EuropeEcuadorEgyptEl SalvadorEnglandEritreaEthiopiaEuropeFijiFranceGermanyGhanaGreeceGrenadaGuatemalaGuyanaHaitiHondurasHong KongHungaryIndiaIndonesiaIranIraqIrelandIsraelItalyJamaicaJapanJordanKazakhstanKenyaKoreaKuwaitLaosLatin AmericaLatviaLebanonLiberiaLithuaniaMalaysiaMexicoMicronesiaMiddle AfricaMoldovaMoroccoNepalNetherlandsNicaraguaNigeriaNorth AmericaNorth MacedoniaNorthern AfricaNorthern EuropeNorwayOceaniaPakistanPanamaPeruPhilippinesPolandPortugalRomaniaRussiaSaudi ArabiaScotlandSenegalSerbiaSierra LeoneSingaporeSomaliaSouth AfricaSouth AmericaSouth Central AsiaSouth Eastern AsiaSouthern EuropeSpainSri LankaSt. Vincent and the GrenadinesSudanSwedenSwitzerlandSyriaTaiwanThailandTrinidad and TobagoTurkeyUgandaUkraineUruguayUzbekistanVenezuelaVietnamWest IndiesWestern AfricaWestern AsiaWestern EuropeYemenZaireZimbabweAzores
Portuguese
Race
Ancestry
AfghanAfricanAlaska NativeAlaskan AthabascanAlbanianAleutAlsatianAmericanApacheArabArapahoArgentineanArmenianAssyrian/Chaldean/SyriacAustralianAustrianBahamianBangladeshiBarbadianBasqueBelgianBelizeanBermudanBhutaneseBlackfeetBolivianBrazilianBritishBritish West IndianBulgarianBurmeseCajunCambodianCanadianCape VerdeanCarpatho RusynCelticCentral AmericanCentral American IndianCherokeeCheyenneChickasawChileanChineseChippewaChoctawColombianColvilleComancheCosta RicanCreeCreekCroatianCrowCubanCypriotCzechCzechoslovakianDanishDelawareDominicanDutchDutch West IndianEastern EuropeanEcuadorianEgyptianEnglishEstonianEthiopianEuropeanFijianFilipinoFinnishFrenchFrench American IndianFrench CanadianGermanGerman RussianGhanaianGreekGuamanian/ChamorroGuatemalanGuyaneseHaitianHmongHonduranHopiHoumaHungarianIcelanderIndian (Asian)IndonesianInupiatIranianIraqiIrishIroquoisIsraeliItalianJamaicanJapaneseJordanianKenyanKiowaKoreanLaotianLatvianLebaneseLiberianLithuanianLumbeeLuxembourgerMacedonianMalaysianMalteseMarshalleseMenomineeMexicanMexican American IndianMongolianMoroccanNative HawaiianNavajoNepaleseNew ZealanderNicaraguanNigerianNorthern EuropeanNorwegianOkinawanOsageOttawaPaiutePakistaniPalestinianPanamanianParaguayanPennsylvania GermanPeruvianPimaPolishPortuguesePotawatomiPuebloPuerto RicanPuget Sound SalishRomanianRussianSalvadoranSamoanScandinavianScotch-IrishScottishSeminoleSenegaleseSerbianShoshoneSierra LeoneanSiouxSlavicSlovakSloveneSomaliSouth AfricanSouth AmericanSouth American IndianSoviet UnionSpaniardSpanishSpanish AmericanSpanish American IndianSri LankanSubsaharan AfricanSudaneseSwedishSwissSyrianTaiwaneseThaiTlingit-HaidaTohono O'OdhamTonganTrinidadian and TobagonianTsimshianTurkishU.S. Virgin IslanderUgandanUkrainianUruguayanUteVenezuelanVietnameseWelshWest IndianYakamaYaquiYugoslavianYumanYup'ikZimbabwean
Immigration
NonimmigrantsImmigrantsAfghanistanAfricaAlbaniaArgentinaArmeniaAsiaAustraliaAustriaBahamasBangladeshBarbadosBelarusBelgiumBelizeBoliviaBosnia and HerzegovinaBrazilBulgariaBurma/MyanmarCabo VerdeCambodiaCameroonCanadaCaribbeanCentral AmericaChileChinaColombiaCongoCosta RicaCroatiaCubaCzechoslovakiaDenmarkDominicaDominican RepublicEastern AfricaEastern AsiaEastern EuropeEcuadorEgyptEl SalvadorEnglandEritreaEthiopiaEuropeFijiFranceGermanyGhanaGreeceGrenadaGuatemalaGuyanaHaitiHondurasHong KongHungaryIndiaIndonesiaIranIraqIrelandIsraelItalyJamaicaJapanJordanKazakhstanKenyaKoreaKuwaitLaosLatin AmericaLatviaLebanonLiberiaLithuaniaMalaysiaMexicoMicronesiaMiddle AfricaMoldovaMoroccoNepalNetherlandsNicaraguaNigeriaNorth AmericaNorth MacedoniaNorthern AfricaNorthern EuropeNorwayOceaniaPakistanPanamaPeruPhilippinesPolandPortugalRomaniaRussiaSaudi ArabiaSenegalSerbiaSierra LeoneSingaporeSomaliaSouth AfricaSouth AmericaSouth Central AsiaSouth Eastern AsiaSouthern EuropeSpainSri LankaSt. Vincent and the GrenadinesSudanSwedenSwitzerlandSyriaTaiwanThailandTrinidad and TobagoTurkeyUgandaUkraineUruguayUzbekistanVenezuelaVietnamWest IndiesWestern AfricaWestern AsiaWestern EuropeYemenZaireZimbabweAzores
Unemployment Among Ages 65 to 74 years
Income
Poverty
Unemployment
Labor Participation
Family Structure
Vehicle Availability
Education Level
Disability

Unemployment Among Ages 65 to 74 years Comparison

Immigrants from Scotland

Portuguese

Exceptional
Tragic
5.2%
UNEMPLOYMENT AMONG AGES 65 TO 74 YEARS
98.6/ 100
METRIC RATING
81st/ 347
METRIC RANK
5.7%
UNEMPLOYMENT AMONG AGES 65 TO 74 YEARS
0.0/ 100
METRIC RATING
291st/ 347
METRIC RANK

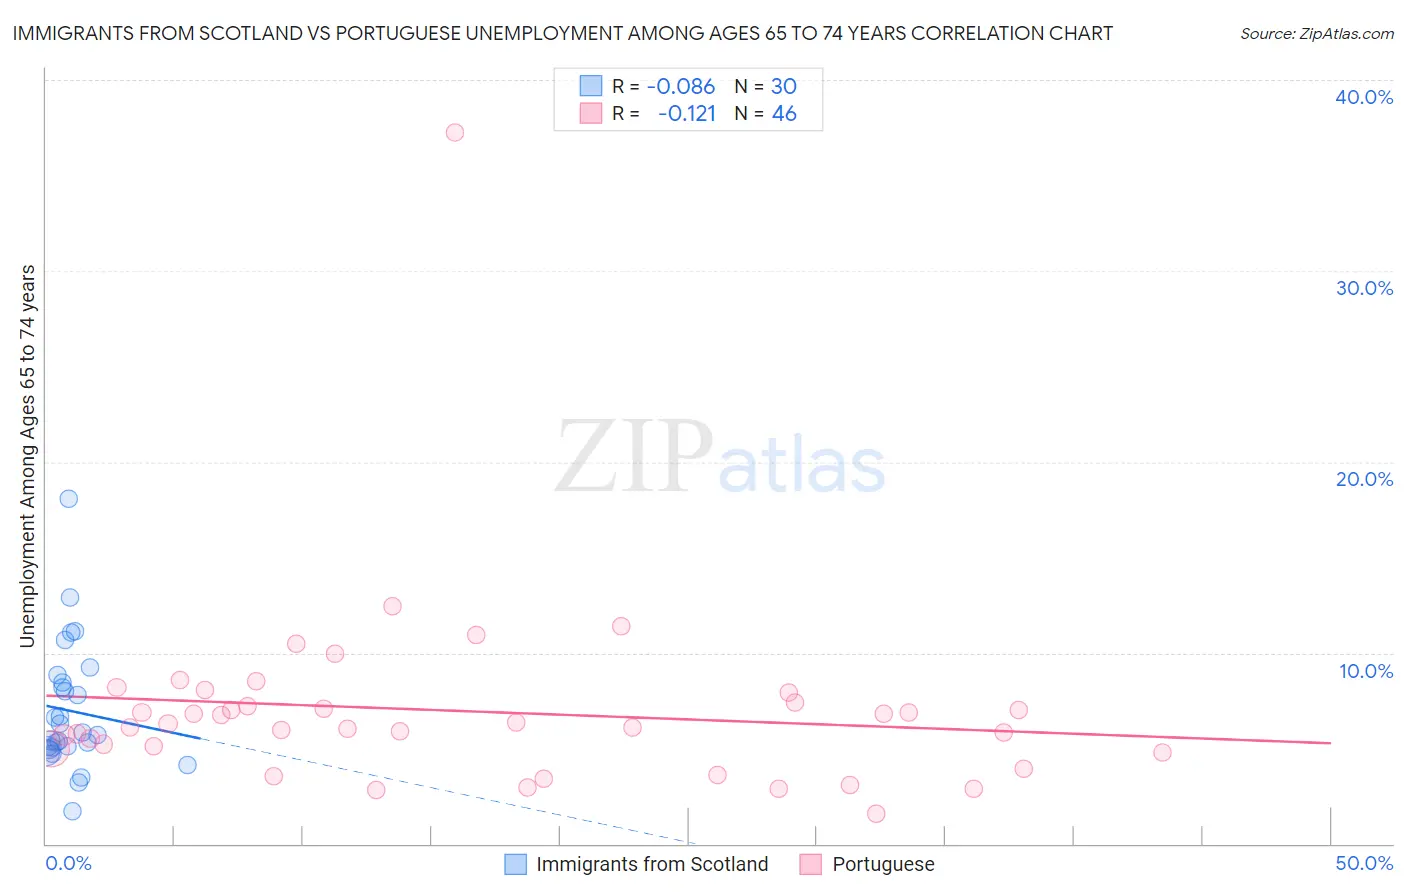
Immigrants from Scotland vs Portuguese Unemployment Among Ages 65 to 74 years Correlation Chart

The statistical analysis conducted on geographies consisting of 183,030,600 people shows a slight negative correlation between the proportion of Immigrants from Scotland and unemployment rate among population between the ages 65 and 74 in the United States with a correlation coefficient (R) of -0.086 and weighted average of 5.2%. Similarly, the statistical analysis conducted on geographies consisting of 385,417,799 people shows a poor negative correlation between the proportion of Portuguese and unemployment rate among population between the ages 65 and 74 in the United States with a correlation coefficient (R) of -0.121 and weighted average of 5.7%, a difference of 11.1%.
Immigrants from Scotland vs Portuguese Unemployment Among Ages 65 to 74 years

Unemployment Among Ages 65 to 74 years Correlation Summary

MeasurementImmigrants from ScotlandPortuguese
Minimum1.7%1.6%
Maximum18.1%37.2%
Range16.4%35.6%
Mean7.0%7.0%
Median5.8%6.2%
Interquartile 25% (IQ1)5.0%5.0%
Interquartile 75% (IQ3)8.5%7.4%
Interquartile Range (IQR)3.4%2.4%
Standard Deviation (Sample)3.3%5.1%
Standard Deviation (Population)3.3%5.1%

Similar Demographics by Unemployment Among Ages 65 to 74 years

Demographics Similar to Immigrants from Scotland by Unemployment Among Ages 65 to 74 years

In terms of unemployment among ages 65 to 74 years, the demographic groups most similar to Immigrants from Scotland are Thai (5.2%, a difference of 0.0%), Immigrants from South Africa (5.2%, a difference of 0.010%), Slavic (5.2%, a difference of 0.030%), Immigrants from Middle Africa (5.2%, a difference of 0.15%), and Northern European (5.2%, a difference of 0.22%).
DemographicsRating | RankUnemployment Among Ages 65 to 74 years
Afghans
99.0
/100
|
#74
Exceptional
5.2%
Okinawans
99.0
/100
|
#75
Exceptional
5.2%
Estonians
99.0
/100
|
#76
Exceptional
5.2%
Immigrants | Sudan
98.9
/100
|
#77
Exceptional
5.2%
Northern Europeans
98.9
/100
|
#78
Exceptional
5.2%
Slavs
98.7
/100
|
#79
Exceptional
5.2%
Immigrants | South Africa
98.6
/100
|
#80
Exceptional
5.2%
Immigrants | Scotland
98.6
/100
|
#81
Exceptional
5.2%
Thais
98.6
/100
|
#82
Exceptional
5.2%
Immigrants | Middle Africa
98.4
/100
|
#83
Exceptional
5.2%
Immigrants | Hungary
98.0
/100
|
#84
Exceptional
5.2%
British
97.9
/100
|
#85
Exceptional
5.2%
Danes
97.9
/100
|
#86
Exceptional
5.2%
Scottish
97.9
/100
|
#87
Exceptional
5.2%
Immigrants | Saudi Arabia
97.9
/100
|
#88
Exceptional
5.2%

Demographics Similar to Portuguese by Unemployment Among Ages 65 to 74 years

In terms of unemployment among ages 65 to 74 years, the demographic groups most similar to Portuguese are Spanish American Indian (5.7%, a difference of 0.040%), U.S. Virgin Islander (5.8%, a difference of 0.22%), Immigrants from Somalia (5.7%, a difference of 0.29%), Central American (5.7%, a difference of 0.30%), and Immigrants from Grenada (5.8%, a difference of 0.32%).
DemographicsRating | RankUnemployment Among Ages 65 to 74 years
Chippewa
0.1
/100
|
#284
Tragic
5.7%
Immigrants | Sierra Leone
0.1
/100
|
#285
Tragic
5.7%
Marshallese
0.1
/100
|
#286
Tragic
5.7%
Central American Indians
0.0
/100
|
#287
Tragic
5.7%
Central Americans
0.0
/100
|
#288
Tragic
5.7%
Immigrants | Somalia
0.0
/100
|
#289
Tragic
5.7%
Spanish American Indians
0.0
/100
|
#290
Tragic
5.7%
Portuguese
0.0
/100
|
#291
Tragic
5.7%
U.S. Virgin Islanders
0.0
/100
|
#292
Tragic
5.8%
Immigrants | Grenada
0.0
/100
|
#293
Tragic
5.8%
Immigrants | Morocco
0.0
/100
|
#294
Tragic
5.8%
Blacks/African Americans
0.0
/100
|
#295
Tragic
5.8%
Pennsylvania Germans
0.0
/100
|
#296
Tragic
5.8%
Houma
0.0
/100
|
#297
Tragic
5.8%
Immigrants | Latin America
0.0
/100
|
#298
Tragic
5.8%