Scandinavian vs Indonesian Unemployment Among Ages 30 to 34 years
COMPARE
Scandinavian
Indonesian
Unemployment Among Ages 30 to 34 years
Unemployment Among Ages 30 to 34 years Comparison
Scandinavians
Indonesians
5.2%
UNEMPLOYMENT AMONG AGES 30 TO 34 YEARS
95.6/ 100
METRIC RATING
76th/ 347
METRIC RANK
5.2%
UNEMPLOYMENT AMONG AGES 30 TO 34 YEARS
95.1/ 100
METRIC RATING
78th/ 347
METRIC RANK
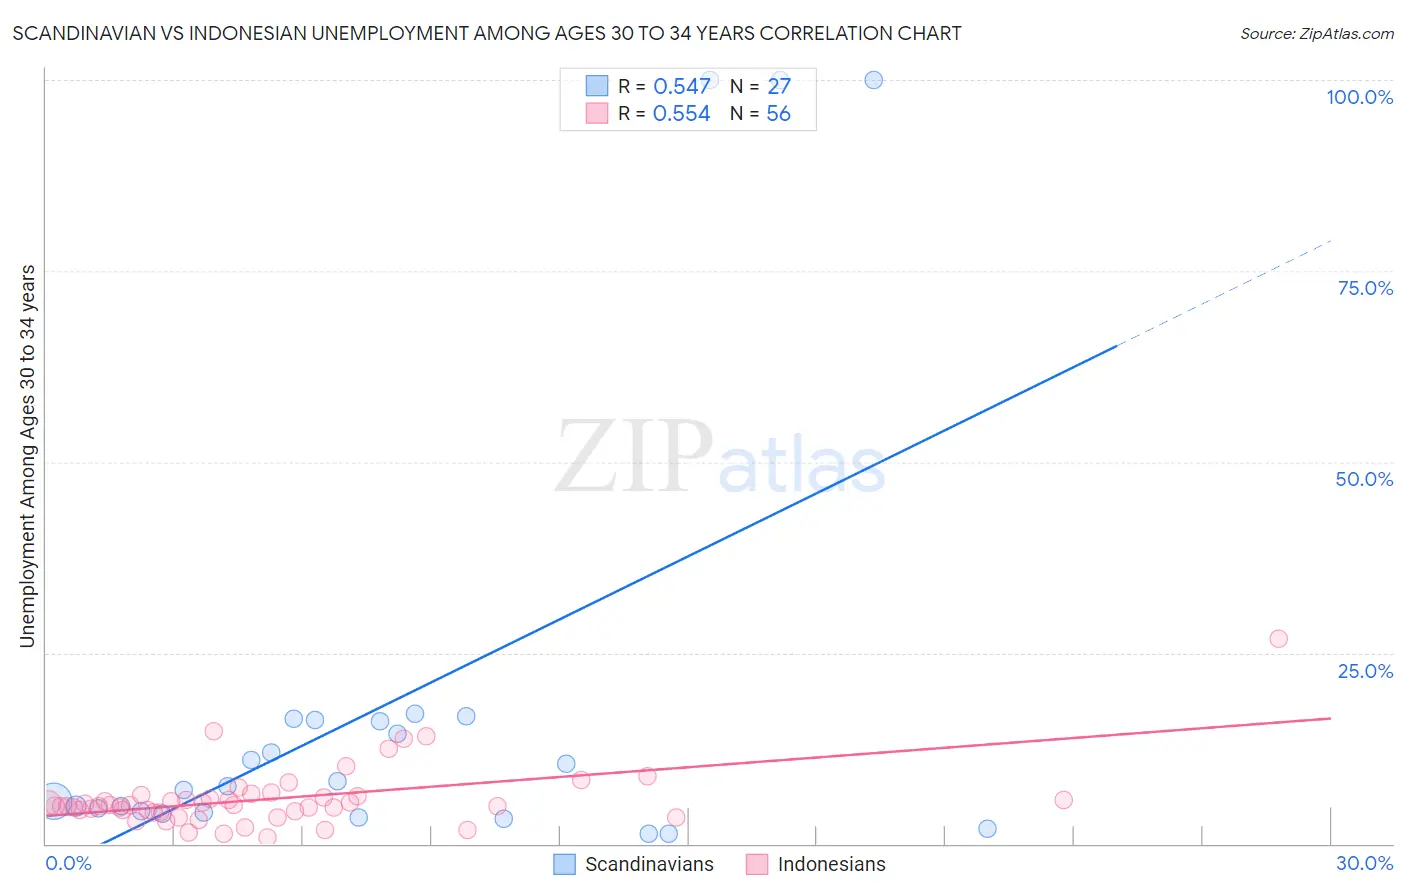
Scandinavian vs Indonesian Unemployment Among Ages 30 to 34 years Correlation Chart
The statistical analysis conducted on geographies consisting of 427,904,410 people shows a substantial positive correlation between the proportion of Scandinavians and unemployment rate among population between the ages 30 and 34 in the United States with a correlation coefficient (R) of 0.547 and weighted average of 5.2%. Similarly, the statistical analysis conducted on geographies consisting of 159,189,213 people shows a substantial positive correlation between the proportion of Indonesians and unemployment rate among population between the ages 30 and 34 in the United States with a correlation coefficient (R) of 0.554 and weighted average of 5.2%, a difference of 0.20%.
Unemployment Among Ages 30 to 34 years Correlation Summary
| Measurement | Scandinavian | Indonesian |
| Minimum | 1.3% | 0.80% |
| Maximum | 100.0% | 26.8% |
| Range | 98.7% | 26.0% |
| Mean | 18.4% | 5.9% |
| Median | 7.6% | 5.0% |
| Interquartile 25% (IQ1) | 4.1% | 4.2% |
| Interquartile 75% (IQ3) | 16.2% | 6.2% |
| Interquartile Range (IQR) | 12.0% | 2.0% |
| Standard Deviation (Sample) | 29.8% | 4.1% |
| Standard Deviation (Population) | 29.3% | 4.0% |
Demographics Similar to Scandinavians and Indonesians by Unemployment Among Ages 30 to 34 years
In terms of unemployment among ages 30 to 34 years, the demographic groups most similar to Scandinavians are Uruguayan (5.2%, a difference of 0.070%), Iranian (5.2%, a difference of 0.21%), Immigrants from Lithuania (5.2%, a difference of 0.25%), Immigrants from Asia (5.2%, a difference of 0.27%), and Slovene (5.2%, a difference of 0.30%). Similarly, the demographic groups most similar to Indonesians are Immigrants from Lithuania (5.2%, a difference of 0.050%), Uruguayan (5.2%, a difference of 0.13%), Immigrants from Indonesia (5.2%, a difference of 0.15%), Chilean (5.2%, a difference of 0.25%), and Immigrants from Latvia (5.2%, a difference of 0.33%).
| Demographics | Rating | Rank | Unemployment Among Ages 30 to 34 years |
| Burmese | 96.5 /100 | #67 | Exceptional 5.1% |
| Jordanians | 96.5 /100 | #68 | Exceptional 5.1% |
| Immigrants | Northern Africa | 96.4 /100 | #69 | Exceptional 5.1% |
| Immigrants | Iraq | 96.4 /100 | #70 | Exceptional 5.1% |
| Paraguayans | 96.4 /100 | #71 | Exceptional 5.1% |
| Immigrants | Moldova | 96.4 /100 | #72 | Exceptional 5.1% |
| Slovenes | 96.2 /100 | #73 | Exceptional 5.2% |
| Immigrants | Asia | 96.2 /100 | #74 | Exceptional 5.2% |
| Iranians | 96.0 /100 | #75 | Exceptional 5.2% |
| Scandinavians | 95.6 /100 | #76 | Exceptional 5.2% |
| Uruguayans | 95.4 /100 | #77 | Exceptional 5.2% |
| Indonesians | 95.1 /100 | #78 | Exceptional 5.2% |
| Immigrants | Lithuania | 95.0 /100 | #79 | Exceptional 5.2% |
| Immigrants | Indonesia | 94.7 /100 | #80 | Exceptional 5.2% |
| Chileans | 94.4 /100 | #81 | Exceptional 5.2% |
| Immigrants | Latvia | 94.2 /100 | #82 | Exceptional 5.2% |
| Immigrants | Korea | 94.1 /100 | #83 | Exceptional 5.2% |
| Immigrants | Uganda | 94.0 /100 | #84 | Exceptional 5.2% |
| Immigrants | Egypt | 93.9 /100 | #85 | Exceptional 5.2% |
| Immigrants | Australia | 93.5 /100 | #86 | Exceptional 5.2% |
| Bhutanese | 93.5 /100 | #87 | Exceptional 5.2% |