Blackfeet vs Immigrants from Eritrea Unemployment Among Ages 16 to 19 years
COMPARE
Blackfeet
Immigrants from Eritrea
Unemployment Among Ages 16 to 19 years
Unemployment Among Ages 16 to 19 years Comparison
Blackfeet
Immigrants from Eritrea
19.2%
UNEMPLOYMENT AMONG AGES 16 TO 19 YEARS
0.0/ 100
METRIC RATING
271st/ 347
METRIC RANK
17.3%
UNEMPLOYMENT AMONG AGES 16 TO 19 YEARS
81.1/ 100
METRIC RATING
139th/ 347
METRIC RANK
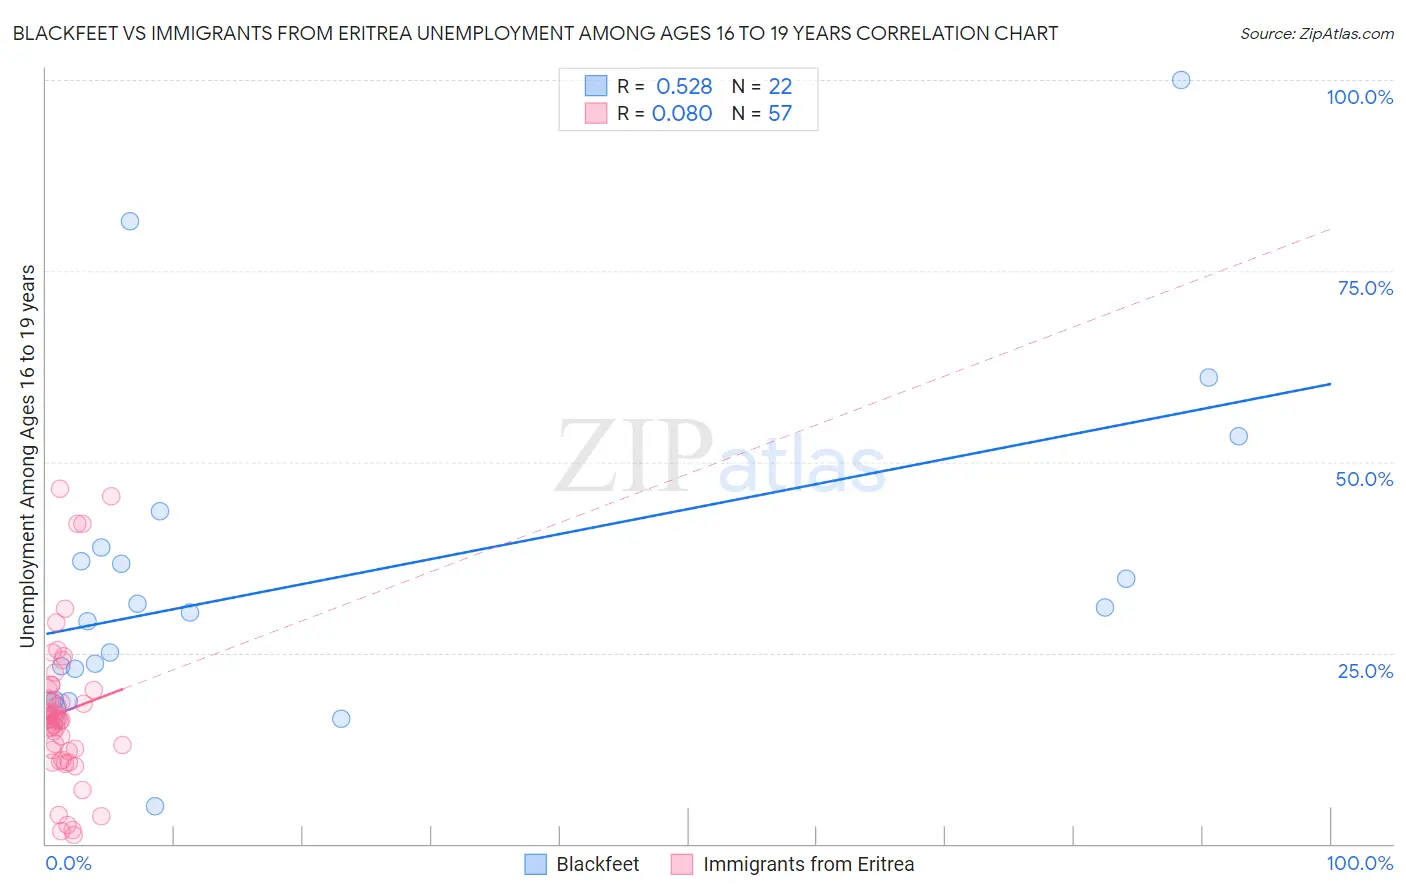
Blackfeet vs Immigrants from Eritrea Unemployment Among Ages 16 to 19 years Correlation Chart
The statistical analysis conducted on geographies consisting of 297,030,644 people shows a substantial positive correlation between the proportion of Blackfeet and unemployment rate among population between the ages 16 and 19 in the United States with a correlation coefficient (R) of 0.528 and weighted average of 19.2%. Similarly, the statistical analysis conducted on geographies consisting of 103,486,787 people shows a slight positive correlation between the proportion of Immigrants from Eritrea and unemployment rate among population between the ages 16 and 19 in the United States with a correlation coefficient (R) of 0.080 and weighted average of 17.3%, a difference of 11.3%.
Unemployment Among Ages 16 to 19 years Correlation Summary
| Measurement | Blackfeet | Immigrants from Eritrea |
| Minimum | 4.9% | 1.1% |
| Maximum | 100.0% | 46.5% |
| Range | 95.1% | 45.4% |
| Mean | 35.4% | 17.3% |
| Median | 30.6% | 16.2% |
| Interquartile 25% (IQ1) | 22.9% | 12.2% |
| Interquartile 75% (IQ3) | 38.7% | 20.1% |
| Interquartile Range (IQR) | 15.9% | 7.9% |
| Standard Deviation (Sample) | 22.0% | 9.8% |
| Standard Deviation (Population) | 21.5% | 9.7% |
Similar Demographics by Unemployment Among Ages 16 to 19 years
Demographics Similar to Blackfeet by Unemployment Among Ages 16 to 19 years
In terms of unemployment among ages 16 to 19 years, the demographic groups most similar to Blackfeet are Hispanic or Latino (19.2%, a difference of 0.12%), Immigrants from Panama (19.3%, a difference of 0.25%), Honduran (19.2%, a difference of 0.38%), Shoshone (19.3%, a difference of 0.40%), and Lumbee (19.1%, a difference of 0.55%).
| Demographics | Rating | Rank | Unemployment Among Ages 16 to 19 years |
| Yaqui | 0.1 /100 | #264 | Tragic 19.0% |
| Choctaw | 0.1 /100 | #265 | Tragic 19.0% |
| Immigrants | Honduras | 0.1 /100 | #266 | Tragic 19.0% |
| Israelis | 0.1 /100 | #267 | Tragic 19.0% |
| Immigrants | El Salvador | 0.1 /100 | #268 | Tragic 19.1% |
| Lumbee | 0.1 /100 | #269 | Tragic 19.1% |
| Hondurans | 0.1 /100 | #270 | Tragic 19.2% |
| Blackfeet | 0.0 /100 | #271 | Tragic 19.2% |
| Hispanics or Latinos | 0.0 /100 | #272 | Tragic 19.2% |
| Immigrants | Panama | 0.0 /100 | #273 | Tragic 19.3% |
| Shoshone | 0.0 /100 | #274 | Tragic 19.3% |
| Paraguayans | 0.0 /100 | #275 | Tragic 19.4% |
| Immigrants | Latin America | 0.0 /100 | #276 | Tragic 19.4% |
| Immigrants | Western Africa | 0.0 /100 | #277 | Tragic 19.4% |
| Africans | 0.0 /100 | #278 | Tragic 19.5% |
Demographics Similar to Immigrants from Eritrea by Unemployment Among Ages 16 to 19 years
In terms of unemployment among ages 16 to 19 years, the demographic groups most similar to Immigrants from Eritrea are Immigrants from Croatia (17.3%, a difference of 0.020%), Basque (17.3%, a difference of 0.030%), Bolivian (17.3%, a difference of 0.070%), Immigrants from Malaysia (17.2%, a difference of 0.14%), and Spanish (17.3%, a difference of 0.14%).
| Demographics | Rating | Rank | Unemployment Among Ages 16 to 19 years |
| Arabs | 83.9 /100 | #132 | Excellent 17.2% |
| Laotians | 83.9 /100 | #133 | Excellent 17.2% |
| Potawatomi | 83.8 /100 | #134 | Excellent 17.2% |
| Samoans | 83.7 /100 | #135 | Excellent 17.2% |
| Immigrants | Oceania | 83.1 /100 | #136 | Excellent 17.2% |
| Immigrants | Malaysia | 82.8 /100 | #137 | Excellent 17.2% |
| Bolivians | 81.9 /100 | #138 | Excellent 17.3% |
| Immigrants | Eritrea | 81.1 /100 | #139 | Excellent 17.3% |
| Immigrants | Croatia | 80.8 /100 | #140 | Excellent 17.3% |
| Basques | 80.7 /100 | #141 | Excellent 17.3% |
| Spanish | 79.3 /100 | #142 | Good 17.3% |
| Immigrants | Egypt | 79.1 /100 | #143 | Good 17.3% |
| Immigrants | England | 78.9 /100 | #144 | Good 17.3% |
| Indians (Asian) | 77.6 /100 | #145 | Good 17.3% |
| Turks | 77.1 /100 | #146 | Good 17.3% |