Canadian vs Immigrants from Eritrea Unemployment Among Ages 16 to 19 years
COMPARE
Canadian
Immigrants from Eritrea
Unemployment Among Ages 16 to 19 years
Unemployment Among Ages 16 to 19 years Comparison
Canadians
Immigrants from Eritrea
16.9%
UNEMPLOYMENT AMONG AGES 16 TO 19 YEARS
96.7/ 100
METRIC RATING
89th/ 347
METRIC RANK
17.3%
UNEMPLOYMENT AMONG AGES 16 TO 19 YEARS
81.1/ 100
METRIC RATING
139th/ 347
METRIC RANK
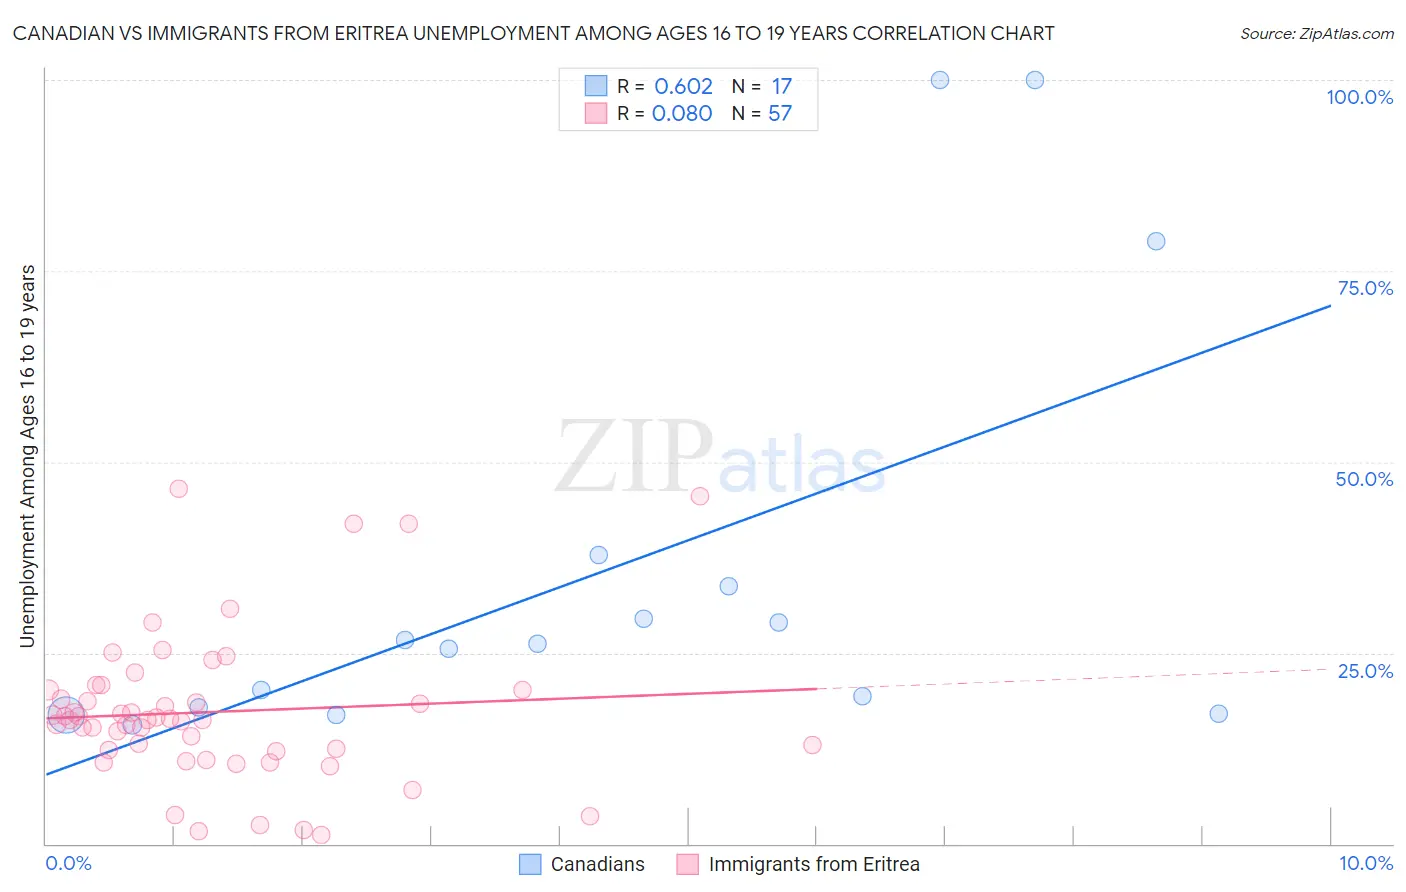
Canadian vs Immigrants from Eritrea Unemployment Among Ages 16 to 19 years Correlation Chart
The statistical analysis conducted on geographies consisting of 409,401,649 people shows a significant positive correlation between the proportion of Canadians and unemployment rate among population between the ages 16 and 19 in the United States with a correlation coefficient (R) of 0.602 and weighted average of 16.9%. Similarly, the statistical analysis conducted on geographies consisting of 103,486,787 people shows a slight positive correlation between the proportion of Immigrants from Eritrea and unemployment rate among population between the ages 16 and 19 in the United States with a correlation coefficient (R) of 0.080 and weighted average of 17.3%, a difference of 2.4%.
Unemployment Among Ages 16 to 19 years Correlation Summary
| Measurement | Canadian | Immigrants from Eritrea |
| Minimum | 15.6% | 1.1% |
| Maximum | 100.0% | 46.5% |
| Range | 84.4% | 45.4% |
| Mean | 35.9% | 17.3% |
| Median | 26.2% | 16.2% |
| Interquartile 25% (IQ1) | 17.4% | 12.2% |
| Interquartile 75% (IQ3) | 35.8% | 20.1% |
| Interquartile Range (IQR) | 18.4% | 7.9% |
| Standard Deviation (Sample) | 28.3% | 9.8% |
| Standard Deviation (Population) | 27.4% | 9.7% |
Similar Demographics by Unemployment Among Ages 16 to 19 years
Demographics Similar to Canadians by Unemployment Among Ages 16 to 19 years
In terms of unemployment among ages 16 to 19 years, the demographic groups most similar to Canadians are Asian (16.9%, a difference of 0.040%), Immigrants from South Africa (16.9%, a difference of 0.090%), Cambodian (16.9%, a difference of 0.12%), Greek (16.9%, a difference of 0.15%), and Immigrants from Scotland (16.8%, a difference of 0.22%).
| Demographics | Rating | Rank | Unemployment Among Ages 16 to 19 years |
| Whites/Caucasians | 97.5 /100 | #82 | Exceptional 16.8% |
| Ugandans | 97.4 /100 | #83 | Exceptional 16.8% |
| French | 97.4 /100 | #84 | Exceptional 16.8% |
| Immigrants | Kuwait | 97.2 /100 | #85 | Exceptional 16.8% |
| Immigrants | Scotland | 97.2 /100 | #86 | Exceptional 16.8% |
| Greeks | 97.0 /100 | #87 | Exceptional 16.9% |
| Immigrants | South Africa | 96.9 /100 | #88 | Exceptional 16.9% |
| Canadians | 96.7 /100 | #89 | Exceptional 16.9% |
| Asians | 96.6 /100 | #90 | Exceptional 16.9% |
| Cambodians | 96.3 /100 | #91 | Exceptional 16.9% |
| South Africans | 95.9 /100 | #92 | Exceptional 16.9% |
| Cubans | 95.8 /100 | #93 | Exceptional 16.9% |
| Bangladeshis | 95.8 /100 | #94 | Exceptional 16.9% |
| Mongolians | 95.6 /100 | #95 | Exceptional 16.9% |
| Ottawa | 95.4 /100 | #96 | Exceptional 16.9% |
Demographics Similar to Immigrants from Eritrea by Unemployment Among Ages 16 to 19 years
In terms of unemployment among ages 16 to 19 years, the demographic groups most similar to Immigrants from Eritrea are Immigrants from Croatia (17.3%, a difference of 0.020%), Basque (17.3%, a difference of 0.030%), Bolivian (17.3%, a difference of 0.070%), Immigrants from Malaysia (17.2%, a difference of 0.14%), and Spanish (17.3%, a difference of 0.14%).
| Demographics | Rating | Rank | Unemployment Among Ages 16 to 19 years |
| Arabs | 83.9 /100 | #132 | Excellent 17.2% |
| Laotians | 83.9 /100 | #133 | Excellent 17.2% |
| Potawatomi | 83.8 /100 | #134 | Excellent 17.2% |
| Samoans | 83.7 /100 | #135 | Excellent 17.2% |
| Immigrants | Oceania | 83.1 /100 | #136 | Excellent 17.2% |
| Immigrants | Malaysia | 82.8 /100 | #137 | Excellent 17.2% |
| Bolivians | 81.9 /100 | #138 | Excellent 17.3% |
| Immigrants | Eritrea | 81.1 /100 | #139 | Excellent 17.3% |
| Immigrants | Croatia | 80.8 /100 | #140 | Excellent 17.3% |
| Basques | 80.7 /100 | #141 | Excellent 17.3% |
| Spanish | 79.3 /100 | #142 | Good 17.3% |
| Immigrants | Egypt | 79.1 /100 | #143 | Good 17.3% |
| Immigrants | England | 78.9 /100 | #144 | Good 17.3% |
| Indians (Asian) | 77.6 /100 | #145 | Good 17.3% |
| Turks | 77.1 /100 | #146 | Good 17.3% |